- Polkadot price analysis is bearish today.
- Support is still standing at $50.1.
- Resistance is found at $53.4.
The Polkadot price analysis is on the bearish side for today as well. DOT/USD hasn’t got the support to move up yet, as the price has come down to $50.4 today, and if it goes below $49, then, as said in our previous analysis, this will cancel out the bullish scenario completely, and the Polkadot may continue the downside for a longer period. The next inline support is present at $50.1, which is crucial to remain intact for upwards move higher.
DOT/USD 1-day price chart: Coin continues downside
The 1-day Polkadot price analysis shows that a decrease in the price of the cryptocurrency has been observed again today as the coin is trading at $50.4 at the time of writing as the price continues downside. The DOT/USD shows a loss in value of more than five percent over the last 24 hours, but Polkadot still shows a nominal increase in value of 0.39 percent over the course of the last seven days, which may turn into negative if the downtrend continues. The market cap has also receded by 4.44 percent over the last 24 hours.
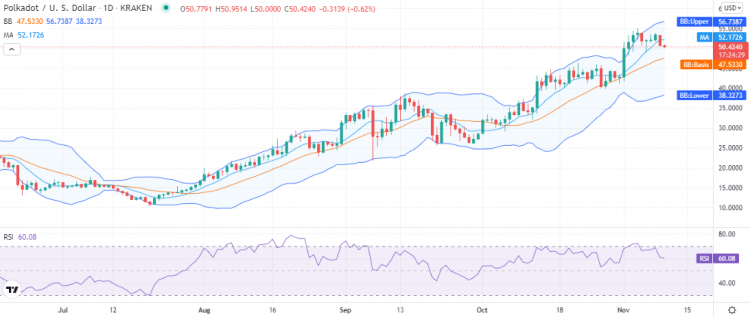
The volatility is still high for the Polkadot, as the upper Bolinger band is at the $56 mark representing resistance, and the lower band is at the $38 mark, the average of the Bollinger bands at the $47 mark represents support for the DOT/USD. The price has also traveled below the moving average (MA) today, which is a bearish crossover.
The relative strength index has further come down to index 60 in the upper half of the neutral zone, the RSI score is still on the upper side, but the steep downwards curve of the RSI shows the selling activity in the market.
Polkadot price analysis: Recent developments and further technical indications
The 4-hour Polkadot price analysis shows that the price breakout was downwards at the start of today’s session, but bullish support arose when the price went down to $50.3, and the price has recovered nominally as it trades at $50.4 now.
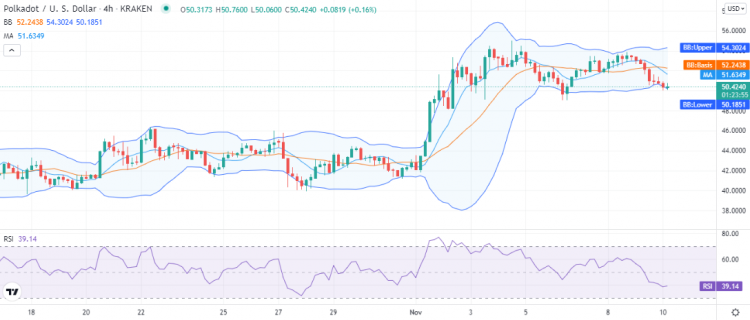
The volatility on the 4-hour chart is mild, but the Bollinger bands show some divergence. The price was just rescued near the lower limit of the Bollinger bands, which acted as support at $50.1. The mean average of the indicator at $52.2 represents resistance for the DOT/USD. The RSI shows signs of improvement, as it is trading at index 39 after stooping low in the lower half of the neutral zone.
Polkadot price analysis conclusion
The Polkadot price analysis shows that the coin’s price was rescued just near the $50 mark. Chances are there for further improvement as the price has improved during the last hours. We expect the DOT/USD to recover to $51.5 in the coming hours if the bullish support persists.
Disclaimer. The information provided is not trading advice. Cryptopolitan.com holds no liability for any investments made based on the information provided on this page. We strongly recommend independent research and/or consultation with a qualified professional before making any investment decisions.