- Litecoin price analysis is bearish today.
- Support for LTC is present at $245.
- Resistance is found at $294.
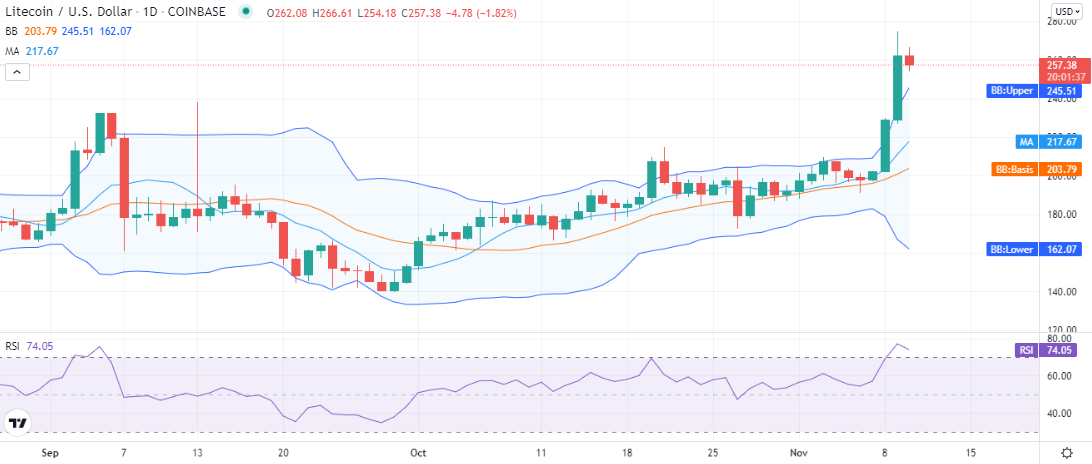
The Litecoin price analysis reveals the coin rejected further upside after reaching $262. Selling pressure from the market triggered as the LTC/USD pair was on the rise for three days, starting from 7th November at $196 and went up to $262 yesterday on 9th November, LTC even swang as high as $274 for some time, but the price was capped at $262 yesterday. During the past three days, the LTC showed tremendous performance and gained significant value dramatically, though the crypto was on an upward trend from 29th September, the price increments were not as dramatic as the recent rally. However, the last three days observed swing high and a good breakout after a long time.
LTC/USD 1-day price chart: LTC corrects at $257
The 1-day Litecoin price analysis shows that the crypto pair’s price has reduced today, as the coin is trading at $257 at the time of writing, coming down from $262. As the LTC rallied high yesterday and the coin still shows an increase in value by more than four percent, which will decrease with time if the correction continues for long.
LTC/USD also reports an increase in value of 27 percent over the course of the last seven days, as the price trend was upwards during the entire week. However, the trading volume has decreased today but may improve as the day passes by as the increment in trading volume has decreased to 63 percent as compared to yesterday’s trading volume increment of 163 percent, which shows a decrease of more than half the previous value.

The volatility for LTC/USD started increasing on 7th November when the coin started the bull rally, increasing the volatility dramatically as now the upper limit of the Bollinger bands stand at the $245 mark representing support for LTC, and the lower band stands at the $162 mark, forming the average at the $203 mark. The moving average (MA) is trading at the $217 mark.
The Litecoin is still in oversold conditions, as the relative strength index (RSI) predicts. The RSI is trading at index 74 in the oversold region but has taken a turn towards the direction of the neutral zone indicating the selling activity in the market.
Litecoin price analysis: Recent developments and further technical indications
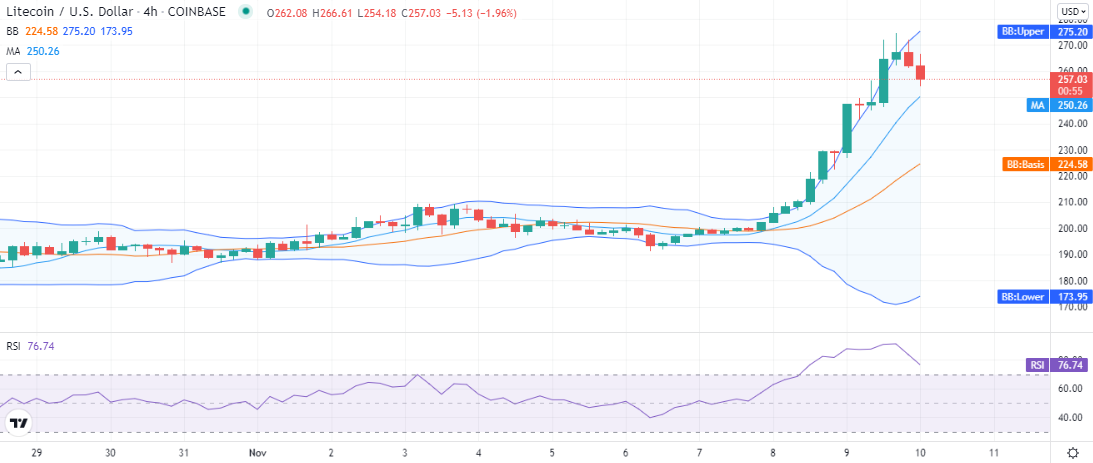
The 4-hour Litecoin price analysis shows the selling pressure triggered during the last 4-hours of yesterday’s session and continues till now. Litecoin is expected to continue the downside today.

The Bollinger Bands on the 4-hour chart also show divergence indicating higher levels of volatility for the crypto pair, with the upper band at $275 indicating resistance for the coin price and the lower band is found at $173, the average of the indicator represents the support for the cryptocurrency at the $224 mark. The MA is trading at the $250 mark below the price level. The RSI though still in the higher bullish zone at index 76 but is signaling the selling of LTC assets in the market.
Litecoin price analysis conclusion
The Litecoin price analysis shows that the coin has started correcting after the bullish run to $262, as it has come down to the $257 level. We expect the LTC to continue correction for the next 24 hours, as according to our analysis, the coin may continue downside till it reaches the $235 range before it heads up for the next move higher and challenges the resistance cluster around the $290 range.
Disclaimer. The information provided is not trading advice. Cryptopolitan.com holds no liability for any investments made based on the information provided on this page. We strongly recommend independent research and/or consultation with a qualified professional before making any investment decisions.
 cryptopolitan.com