GRT coin price experiences a boom in buying pressure leading to a crucial resistance breakout. As a result, it may soon touch $1.35.
The Graph is a blockchain-powered indexing protocol useful in querying data in the networks like Ethereum and IPFS. The platform has utilization in DeFi and various other applications in Web3.
Let us now take a look at the technical analysis of The Graph.
Past Performance of GRT
Considering the $1.08 as the previous swing high, the GRT coin price breaks above the crucial resistance zone due to an increase in buying pressure, evident by the rise in intraday trading volume of 30%. The GRT coin trades at $1.11 with a 5% growth in the past 24 hours.
Moreover, the Fibonacci Retracement levels indicate the next resistance at $1.35, coinciding with the $1.618 level. Hence, if the price sustains above $1.10, we can shortly see a bull run to the $1.35 mark.
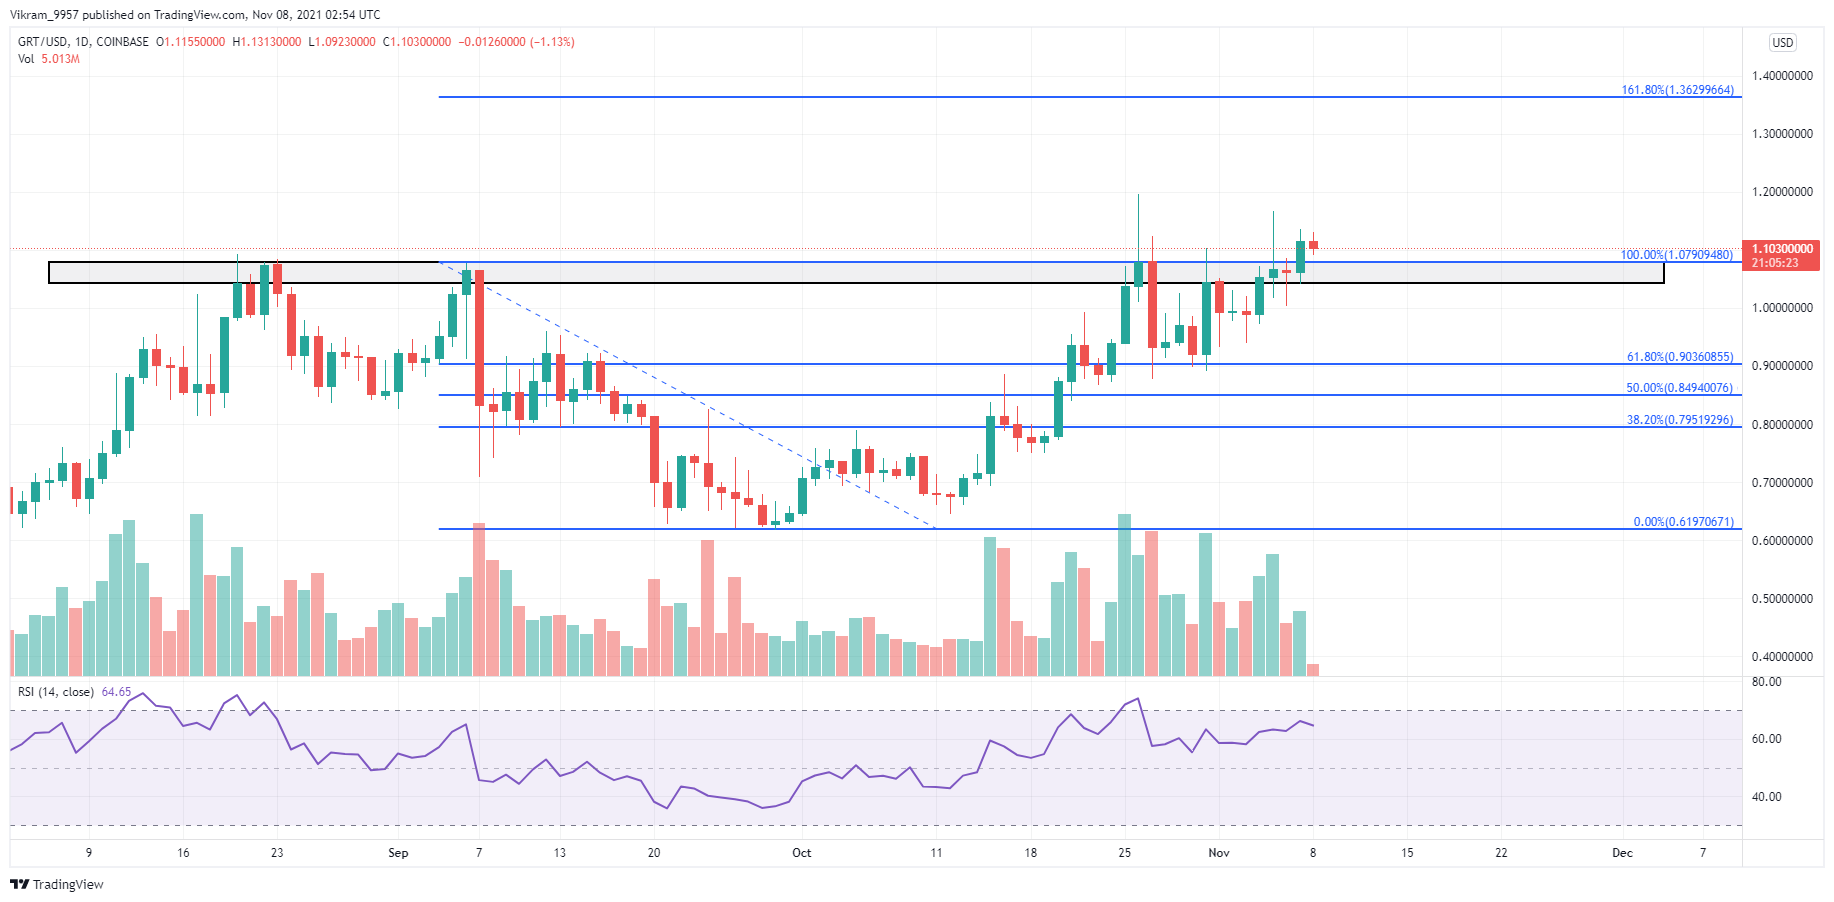
GRT/USD Daily Chart
GRT Technical Analysis
GRT coin price action highlights the zone near the $1.10 mark as a crucial level. Thus, a breakout of this level reflects a strong buying signal for price action traders.
The breakout of the $1.10 resistance can be considered a suitable entry spot. Pivot Points indicate supply levels near $1.28 and $1.50. However, if the price slips to support the buying pressure, the $0.96 and $0.72 levels can cushion the downfall.
The RSI slope in the daily chart is slightly below the overbought territory. Moreover, the slope showcases a gradual rise from 55%. Hence, the RSI indicator projects a strong underlying bullishness in GRT coin price.
In the daily chart, the MACD and signal lines rise higher. The bullish alignment is evident by the fast line that is above the slow line. Also, the histograms show continuous growth in bullish momentum. Hence, the MACD indicator generates a buy signal.
Upcoming Trend
As per the technical analysis of The Graph, the GRT token price breaks above a crucial price action level near the $1.10 mark. Moreover, the technical indicators reflect the growth in buying pressure. Hence, traders can expect the coin price to touch the $1.3 mark coinciding with the next Fibonacci resistance level.