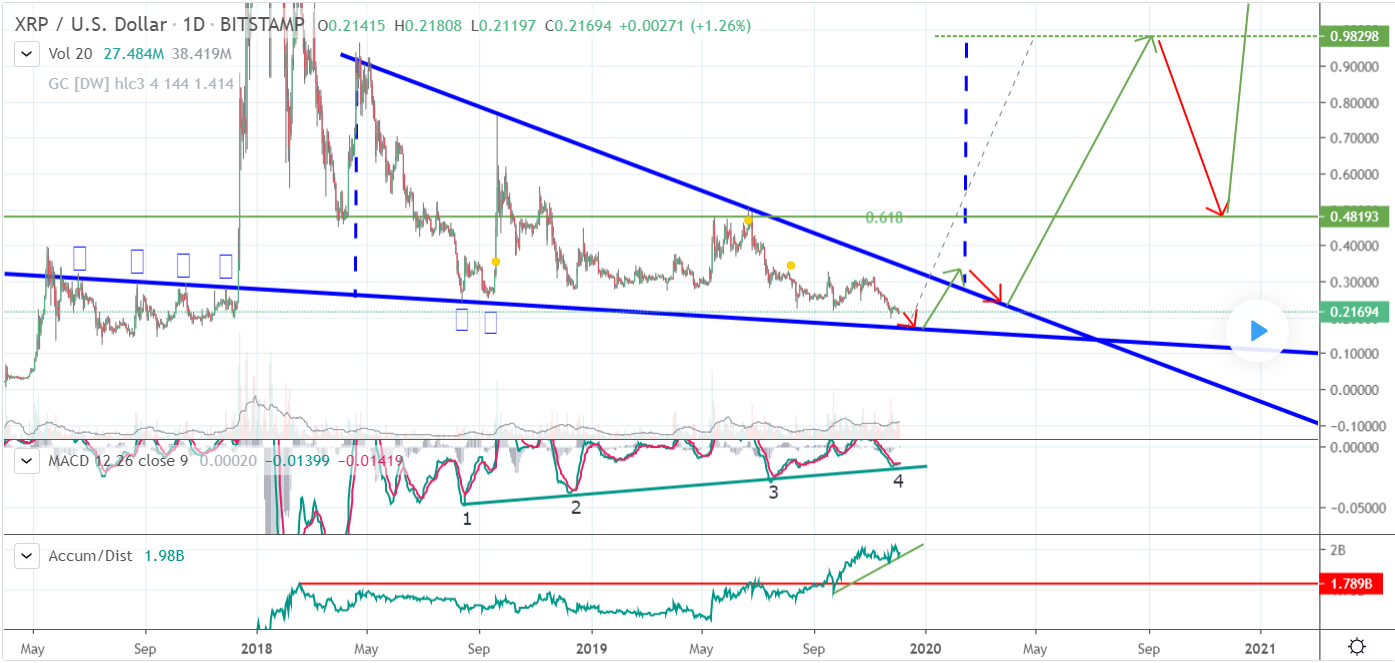
According to the long-term forecast of a user of the TradingView website under nickname MagicPoopCannon, the XRP rate will see a peak at about $ 1.00 in September 2020. At the same time, in January, the rate will increase by 27%.
Forecast Of The Dynamics Of XRP Exchange Rate
Source: TradingView.com
In March 2018, a downward triangle started to form on the XRP chart. The lower border of the figure is at the level of the resistance zone, which is valid until the coin rate pump in December 2017.
Upon reaching this mark, the price of cryptocurrency fell sharply. However, when buyers managed to break through the barrier, a powerful upward movement arose.
When the XRP rate reached ATH, the price of the token fell to the bottom line of the triangle only two times: August 14 and September 11, 2018. The existence of a descending wedge indicates the preservation of the bearish trend at least until the end of 2019.
When the value of the asset falls to the lower side of the figure, an upward trend will arise. XRP price could potentially rise to $ 0.28 until January 31, 2020. If the upper boundary of the triangle, which acts as the resistance, is broken, then the digital token XRP will continue to rise in price. Otherwise, you should expect a rebound down to $ 0.15.
At the moment, the MACD indicator is rising in the same way as in 2016, which indicates bullish divergence. Since mid-2018, there has been a decrease in seller pressure on the market.
Moreover, we can see that in September 2019, the asset acquisition volume indicator exceeded the record figure for the entire history of the coin’s existence (indicated by a red line). From that moment, the number of XRP purchased began to increase rapidly. This suggests that whales continue to build up cryptocurrency reserves.
To calculate the maximum growth rate of the XRP, we have to take into account the height of the triangle (marked with a blue dashed line) and the lower border, which is in the region of $ 0.10.
Using these indicators to determine the Fibonacci levels, we can conclude that the ascending triangle will be symmetrical to the descending one. Thus, the upper limit ($ 0.98) will be reached in September 2020.
Short-Term Analysis Of XRP Token
Source: TradingView.com
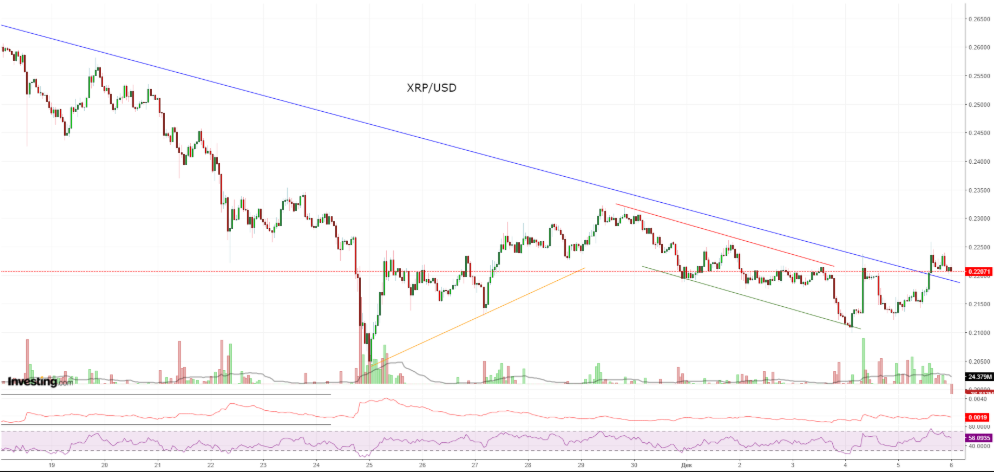
At the press time, Ripple’s token is trading at $ 0.2213 with a daily growth of 2.64%. Note that XRP shows the best result among the TOP-10 coins of the CoinMarketCap market capitalization rating.
XRP/USD broke through the downtrend line. This indicates that there may be some shifts in the supply and demand balance. However, such behavior of the participants does not give rise to the beginning of active actions with the token at this stage.
In order to talk about a trend changes, confirmation is needed, for example, fixing quotes above the maximum of November 29 ($ 0.232).
However, the fundamental factors that create pressure on XRP/USD from a large seller remain, therefore, the dynamics of the token will largely depend on the mood in the market as a whole.