On-chain data from Santiment shows Bitcoin wallet activity continues to grow as it hits a new 5-month high in activities as the price of Bitcoin has failed to show promising moves in the past few weeks as price remains in a range below $26,500.
Bitcoin’s (BTC) price is yet to show signs of its impending halving in 2024 as many analysts and investors speculate the lower price action of Bitcoin in the present bear market is a cause for worry. It could lead to a different trend in Bitcoin price rally than in the past.
The price of Bitcoin continues to attract much attention, considering it would have had a big impact on the cryptocurrency market and the prices of other altcoins as its halving approaches in 6 months, around April of 2024.
Will Bitcoin price reclaim its previous all-time high of $69,000 and surpass its high of $200,000? This has been one of the talking points of many analysts despite recent high on-chain Bitcoin activities.
Although Bitcoin has shown a glimpse of its price action as price rallied from $16,000 to $32,000, price suffered a shocking decline as it struggled to break above its yearly high.
Compared to last week, the price of Bitcoin looks promising, above $26,500, as the price could aim to go higher to a region of $27,500 if the Bulls increase their activities, as bears have remained much dominant in the past few weeks.
The heat map above shows the current market state after a brief bounce in prices across all markets, with the price of Bitcoin, Ethereum, SOL, XRP, and other weekly top 5 cryptocurrencies showing promising signs of a possible rally higher ahead of a new week.
Ahead of the Consumer Price Index (CPI), the price of Bitcoin suffered a new price decline to a low of $24,800 as the price bounced from that region to a high of $25,800 ahead of the CPI. The price rallied further to a high of $26,800 after the CPI data was released, with BTC bulls holding the price above $26,500.
The price of Bitcoin, holding above $26,500, is a good sign for the bulls as the price could aim to break out from the bearish trend it has maintained for months now. The price of Bitcoin, between $25,000 and $26,500, could give bulls much time to break out into an uptrend.
BTC’s price trades below its 50-day and 200-day Exponential Moving Averages (50-day and 200-day EMAs), indicating that the price needs to break higher and close above $27,500 for more bullish price movement.
The price of Bitcoin on the daily timeframe continues to hold above the 61.8% Fibonacci Retracement Value (61.8% FIB Value) and on other higher timeframes, indicating much advantage for the bulls as the price aims to go higher.
If the price of BTC closes below $24,500, this could be challenging for BTC bulls as bears would aim to push the price lower, but Bitcoin has shown incredible strength holding above $25,000.
The Relative Strength Index (RSI) and Moving Average Convergence Divergence (MACD) on the daily timeframe show a trend change as bulls could push the price higher if $27,500 is reclaimed.
Bitcoin’s price movement has had much effect on Ethereum (ETH) as the price of ETH has remained in a range movement for weeks between the range of $1,570 to $1,650 as the price of Ethereum has failed to reclaim the high of $1,800 to resume its bullish price movement.
Ethereum price trades below its 50-day and 200-day EMAs, indicating that the price remains downtrend despite a short price bounce from $1,550. If the price of ETH holds above $1,500, there are higher chances of bulls flipping the highs of $1,800 into support.
Bitcoin and Ethereum’s price range has remained in the shadows of other top trending altcoins as many altcoins continue to rally with over 500% in weeks leading to key analysis of this week’s top 5 cryptocurrencies (TRB, SHIB, XRP, RNDR, MATIC) to watch.
Shiba Inu (SHIB) Daily (1D) Price Analysis – Top 5 Cryptocurrency to Watch
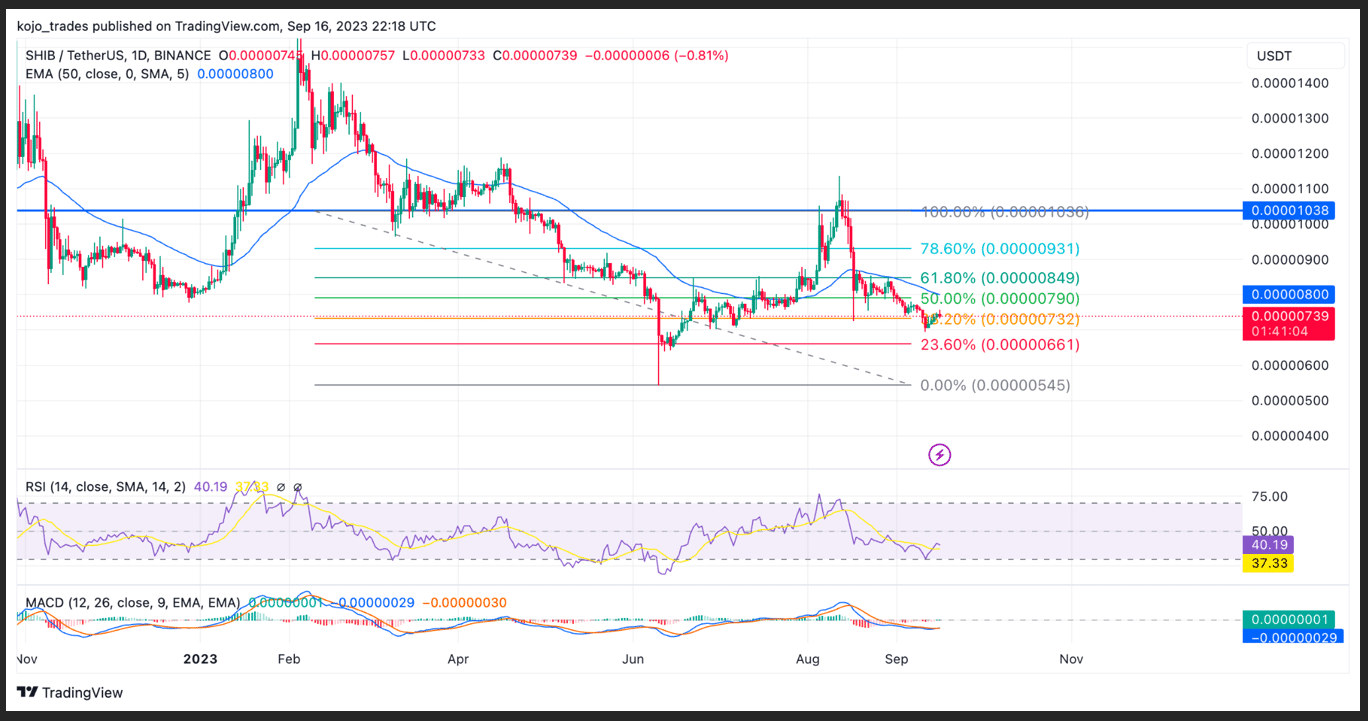
The crypto bear market hasn’t discouraged the likes of the Shiba Inu team, as they have maintained a high need to build and evolve the community during the bear market. Many traders and investors have applauded such innovation and believe SHIB would do well in the nearest altcoin season.
Shiba Inu’s faithful have welcomed the creation of Shibarium and Shiba Inu’s Web3 restaurant as they hope this will be a huge boost and catalyst for the price of SHIB/USDT to rally high.
On-chain data from Sibarium Scan shows high activity on its network since its creation, registering over $2.7 Million successful transactions on the Shibarium chain. Such staggering growth reflects mass adoption by whales and traders.
The price of SHIB/USDT has struggled to rally high after its post-Shibarium launch as the price of SHIB/USDT rallied high to $0.00001100 before suffering rejection from bears from such regions acting as resistance for SHIB price.
SHIB/USDT dropped to a region of $0.00000730 below its 50-day EMA as the price holds well above the key level of 38.2% FIB value as the price could aim to rally high if bulls hold above $0.00000700 to reclaim the resistance at $0.00000850.
If the price of SHIB/USDT reclaims the resistance of $0.00000850, flipping it into the support, we could see the price aiming to rally high to $0.0000220, which will remain an area of supply for bears.
The MACD for SHIB/USDT on the daily timeframe looks promising as the price could resume its bullish trend with the RSI trading just above the 40-mark area.
Major SHIB/USDT support zone – $0.00000700
Major SHIB/USDT resistance zone – $0.00000850
MACD trend – Bullish
Ripple (XRP) Daily (1D) Price Analysis
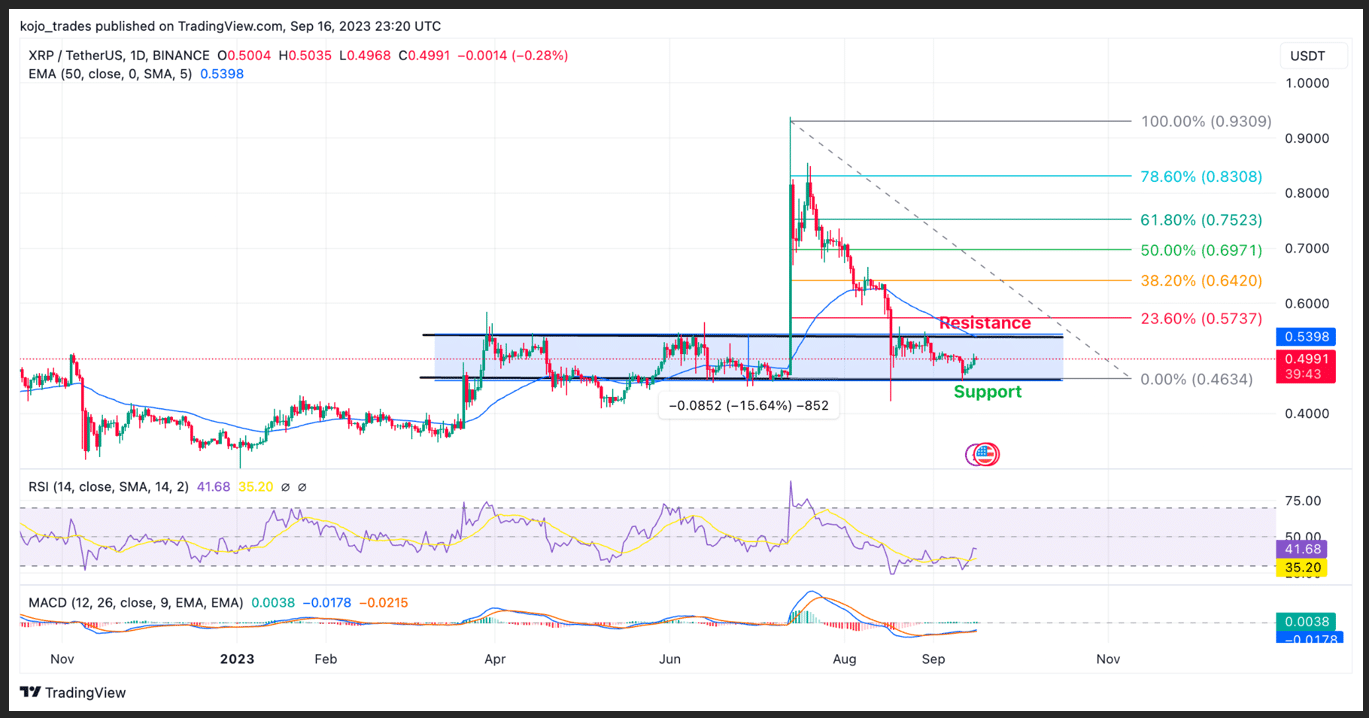
Ripple (XRP) remains a top 5 cryptocurrency for many traders and investors. It is hoped to outperform other higher marketcap cryptocurrencies like Solana and ADA, as it has gained much popularity and partnerships in recent months.
Analysts, investors and traders still hope for a major price rally for Ripple to a high of $5 and more in the coming bull market. Despite the harsh bear market, this cryptocurrency has remained one of the strongest with good fundamentals.
A few weeks back, the price of XRP/USDT was at the brick of breaking $1 as the price rallied past $0.93 before suffering price rejection by bears and has since struggled to replicate such price action.
The price of XRP/USDT has remained in a price range for weeks now as the price has formed strong support at $0.46 as the price retested this region, bouncing off to a high of $0.5.
The price of XRP/USDT needs to break out of its range and close above $0.55 to resume its bullish price rally to a high of $0.75 and possibly $1. If the price of XRP/USDT closes below $0.45, we could see the price retest its yearly low of $0.35.
Ripples MACD and RSI indicators on the daily timeframe suggest that the price could be ready for a minor bounce to its resistance of $0.55 as bears would be looking to reject its price, or bulls could break past this region to initiate a bullish price rally.
Major XRP/USDT support zone – $0.46
Major XRP/USDT resistance zone – $0.55
MACD trend – Bullish
Tellor (TRB) price Analysis as a Top 5 Cryptocurrency to Watch
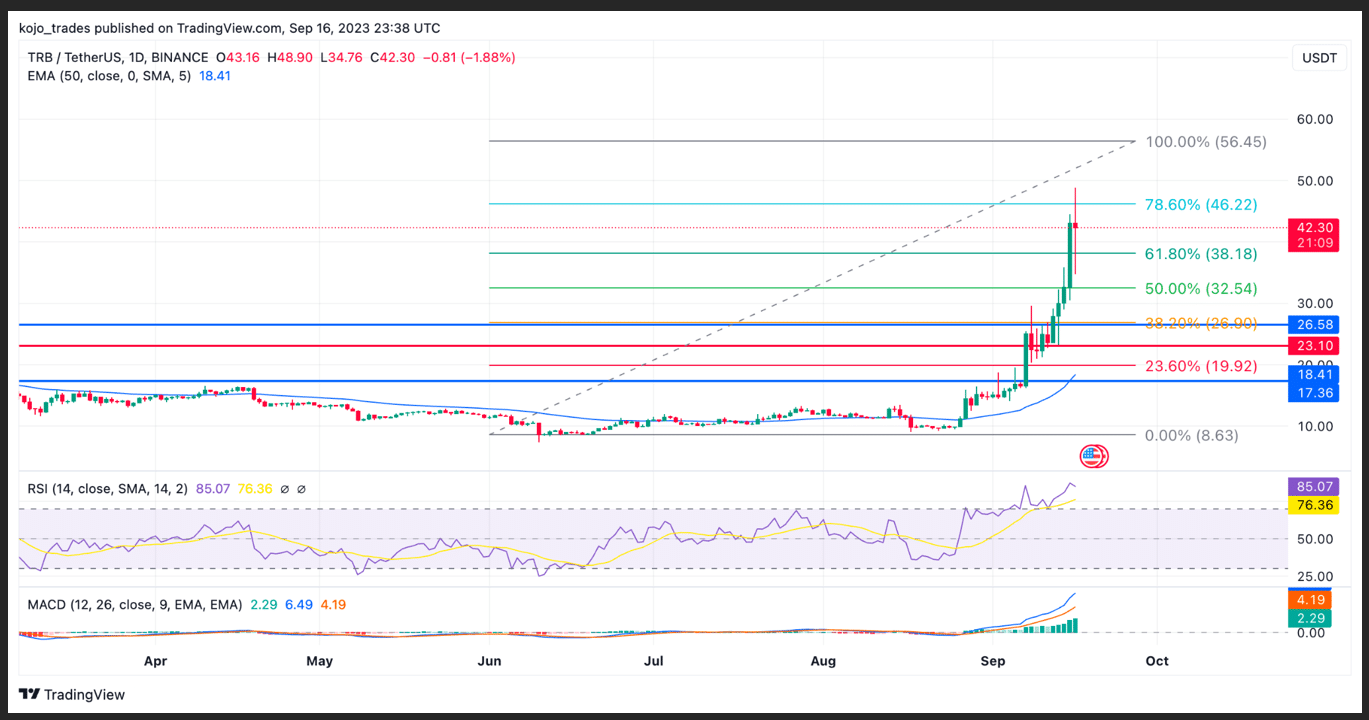
Tellor (TRB) has been one of the top-performing altcoins for the past few weeks, outperforming the likes of Bitcoin, Ethereum, and Polygon Matic. The price action for TRB/USDT suggests the price could still have room to rally high to $55 or $60.
After suffering a price decline of over -60% during this bear market to a low of $9, the price of TRB/USDT formed a good demand zone around $9 as the price bounced from this region, showing a bullish price rally.
The price of TRB/USDT rallied from this low to a high of $20 as the price flipped its bearish price movement to a bullish price movement, with bulls buying more into this token as the price has increased over 500% in the past week.
The price of TRB/USDT currently trades above the 50-day EMA, acting as support for price on the daily timeframe and other higher timeframes.
Tellor’s price rally corresponds with its MACD and RSI movement, indicating bulls are much in control of the price and could push the price higher to $55-$60, but the bear would take over if the price breaks below $25.
Major TRB/USDT support zone – $32
Major TRB/USDT resistance zone – $60
MACD trend – Bullish
Render Token (RNDR) Price Analysis on the Daily (1D) Timeframe
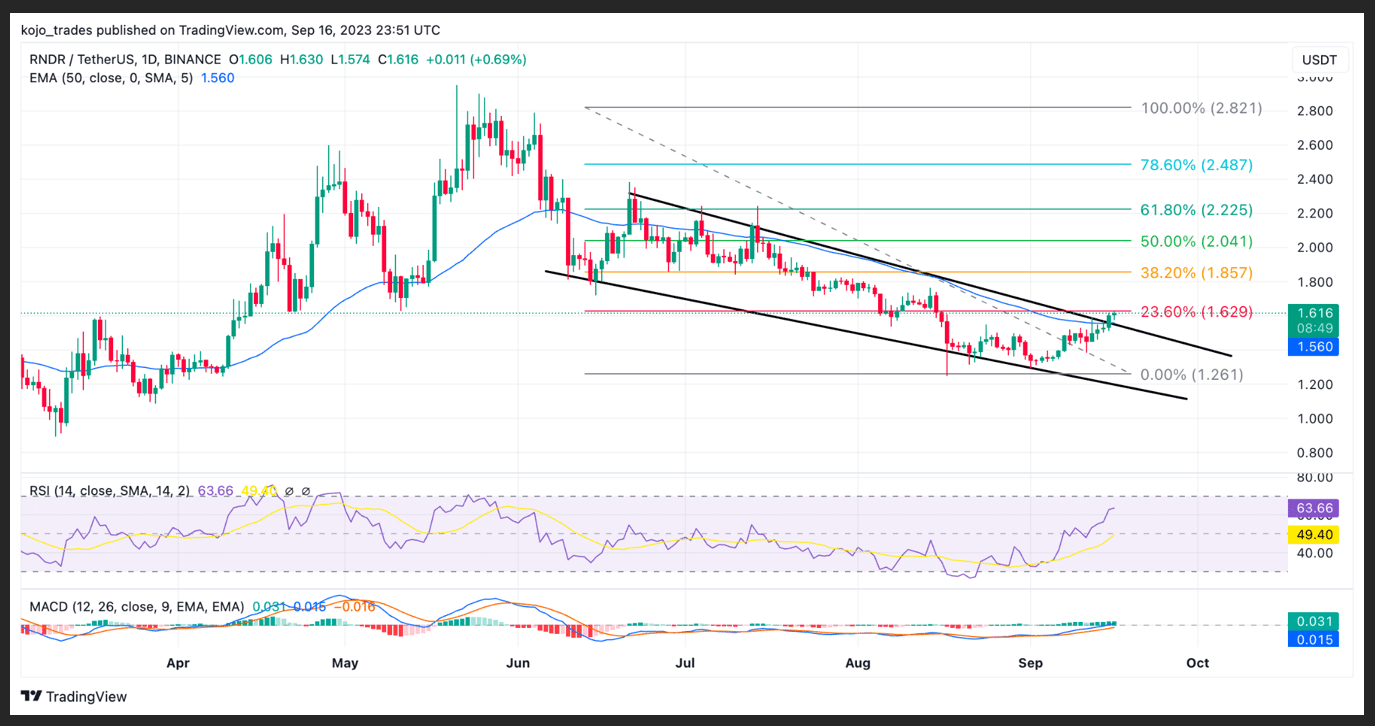
Render Token (RNDR), an AI token (Artificial Intelligence token), remains one of the undervalued tokens with great utility and use case and will continue to grow with much adoption ahead of Bitcoin halving in 2024.
The price of RNDR/USDT has struggled during this bear market as the price has seen over -80% drop from a high of $8 to a low of $0.4 as the price of RNDR/USDT rallied from this region with so much hype suffering AI tokens.
After rallying to a yearly high of $2.9, RNDR’s price declined from this supply zone by bears to a region of $1.25, forming good support for the price. The price of RNDR maintained a downtrend before breaking this trend to an upside.
RNDR trades above the 50-day EMA after a successful breakout from its downtrend. There are high chances of price retesting $2.9-$3 if price reclaims above $1.9, corresponding to 38.2% FIB value, to resume much bullish price action.
The MACD and RSI indicators for RNDR suggest bullish price action as the price could push higher with bulls much in control of the price.
Major RNDR/USDT support zone – $1.9
Major RNDR/USDT resistance zone – $2.5-$3
MACD trend – Bullish
Polygon Matic (MATIC) Price Analysis on the Daily Timeframe
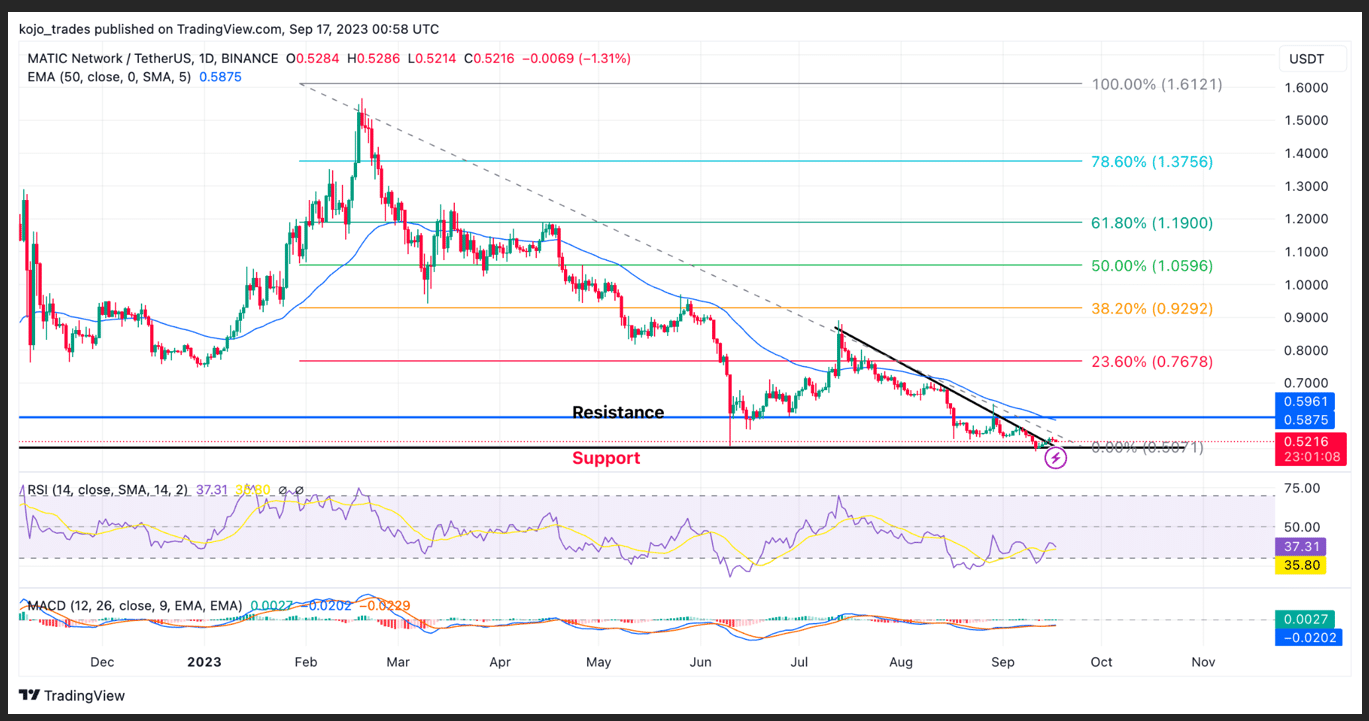
Polygon Matic (MATIC) has struggled to hold above $0.75 support as the price trades below its 50-day EMA, acting as resistance and below $0.55. After rallying to a yearly high of $1.6, the price of MATIC/USDT has suffered a much downtrend.
MATIC’s price has remained considerably under the influence of bears as bulls struggle to change its trend from bearish to bullish.
The price of MATIC/USDT needs to break and close above $0.57 to resume a minor price bounce to a high of $0.65-$0.75. If MATIC’s price fails to close above $0.56, then we could see the bear dominate price more to a region of $0.45.
Polygon Matic needs to reclaim $0.75 for a better bullish bounce corresponding to a 38.2% FIB value and could also signal MACD and RSI trend reversal to a bullish trend.
Polygon Matic remains one of the top 5 cryptocurrencies with a huge community, partnerships and use cases that would continue to shape the cryptocurrency market and help smaller projects looking to enter the blockchain mainstream.
Major MATIC/USDT support zone – $0.5
Major MATIC/USDT resistance zone – $0.65
MACD trend – Bearish
 thecryptobasic.com