BeInCrypto takes a look at seven altcoins, including Solana (SOL), which has just reached a new all-time high price and dYdX (DYDX), which is validating its previous all-time high as support.
BTC
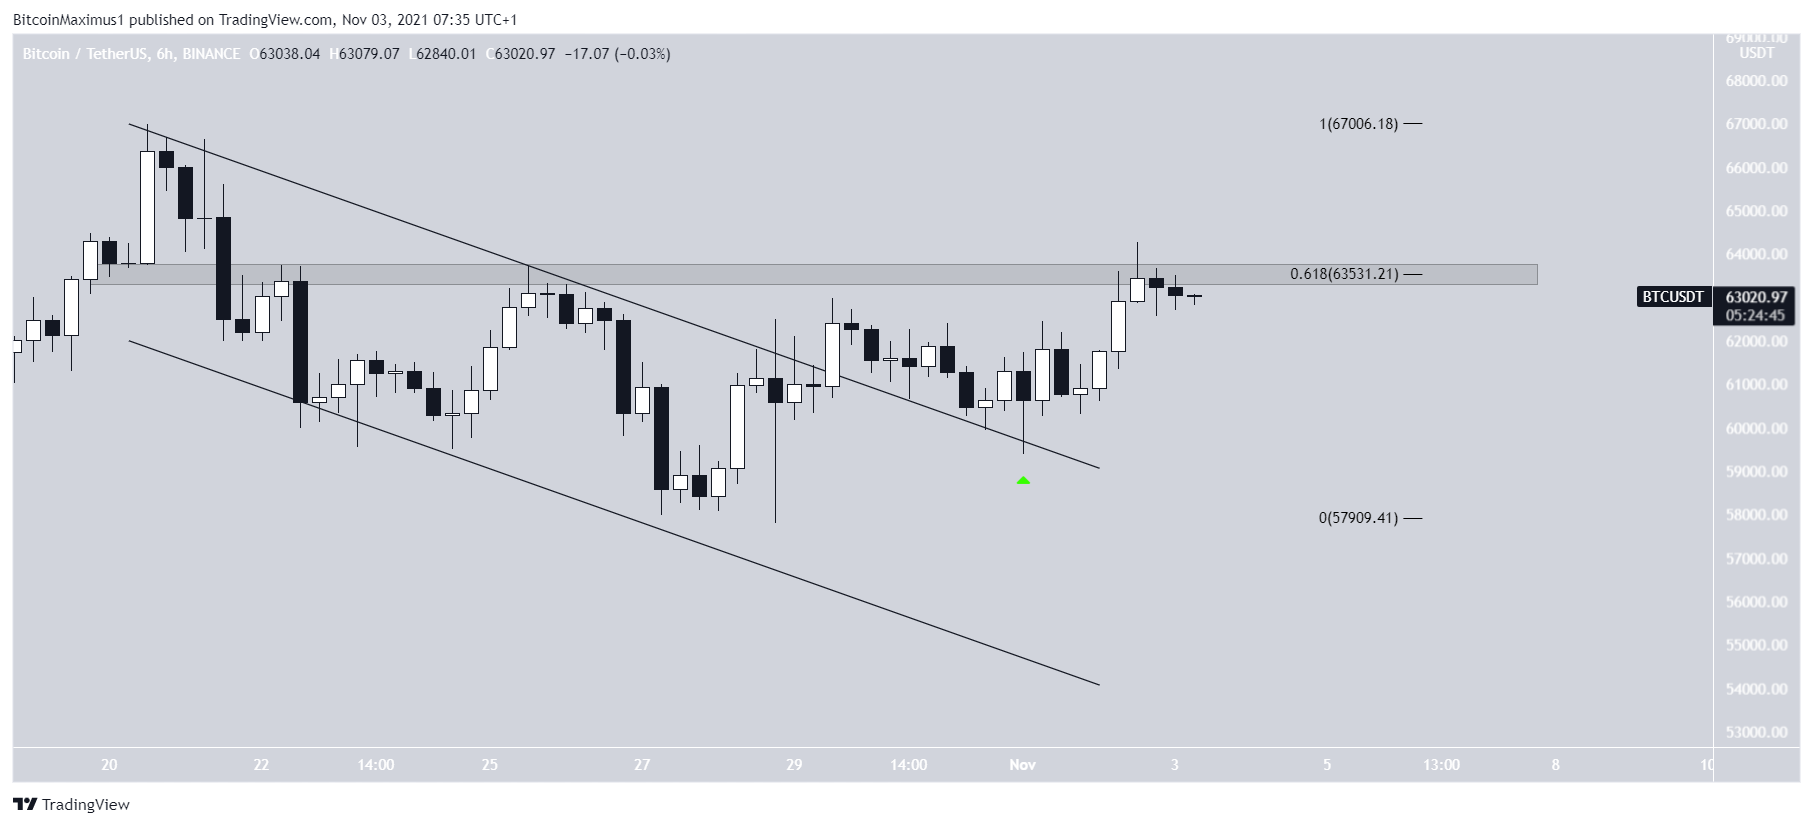
BTC has been increasing since breaking out from a descending parallel channel and validating it as support on Nov 1 (green icon). This showed that the correction in place since the all-time highs is complete.
Currently, BTC is attempting to move above the 0.618 Fib retracement resistance level at $63,530. This is also a horizontal resistance area.
Doing so would confirm that the correction is complete.
ETH
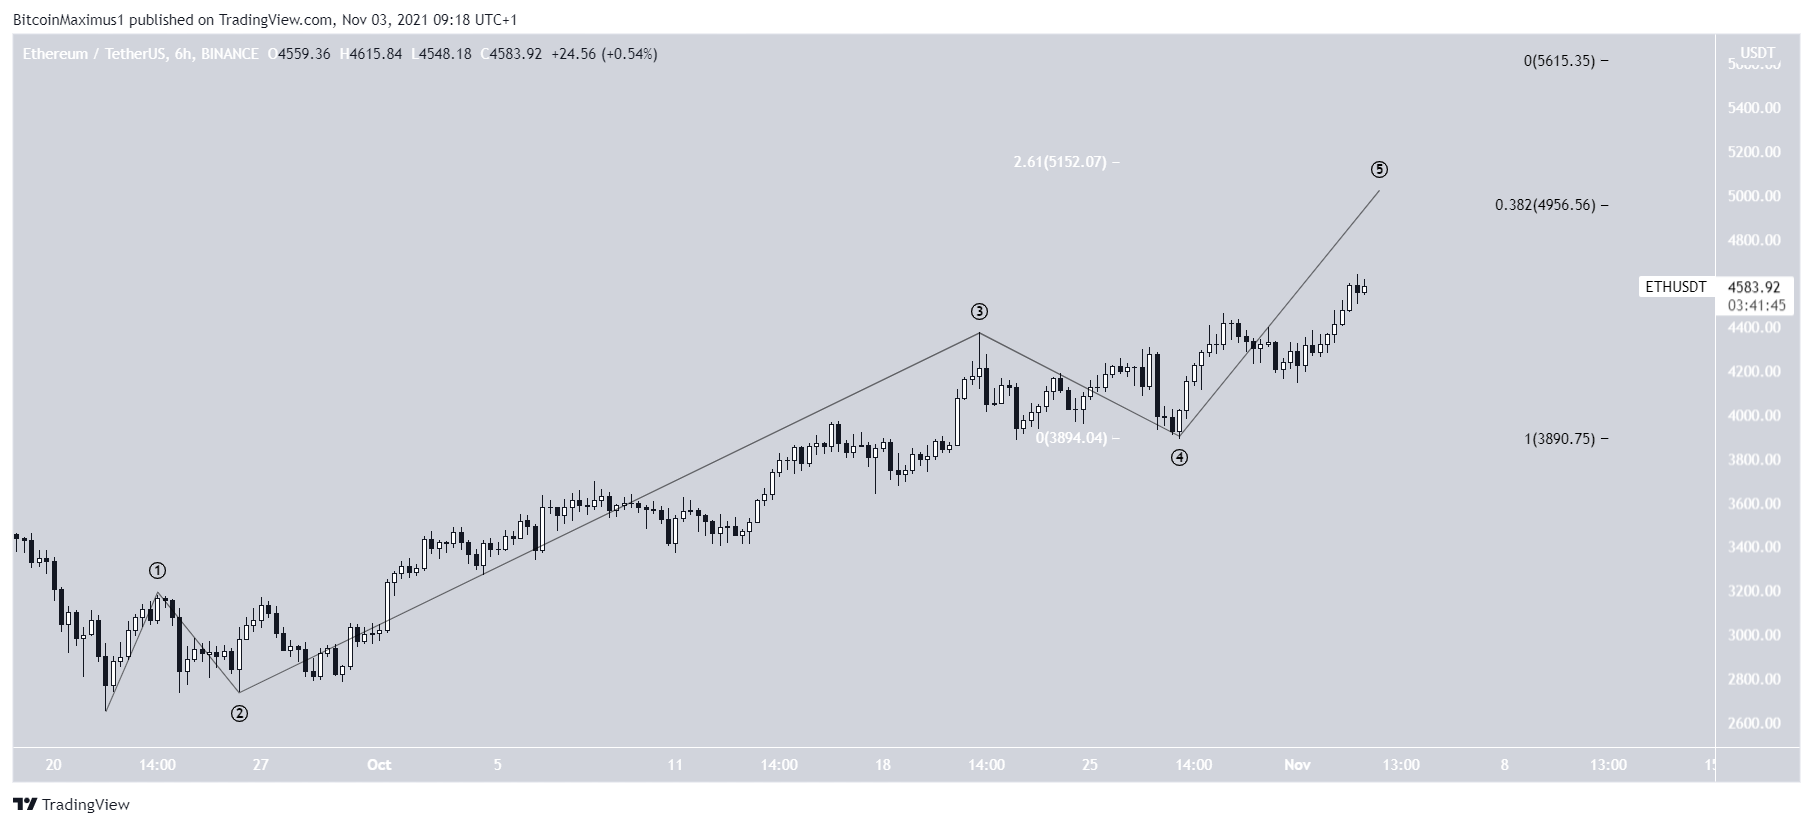
Ethereum (ETH) has been moving upwards at an accelerated rate since Sept 21. It seems to be in wave five of a bullish impulse, which is the final wave, after which a correction is likely.
The most likely targets for the top of the current upward movements are between $4,956 – $5,152 and $5,615. The former is created by using an external Fib retracement on wave four (white) and a projection on waves 1-3 (black), while the latter is found using only a projection.
XRP
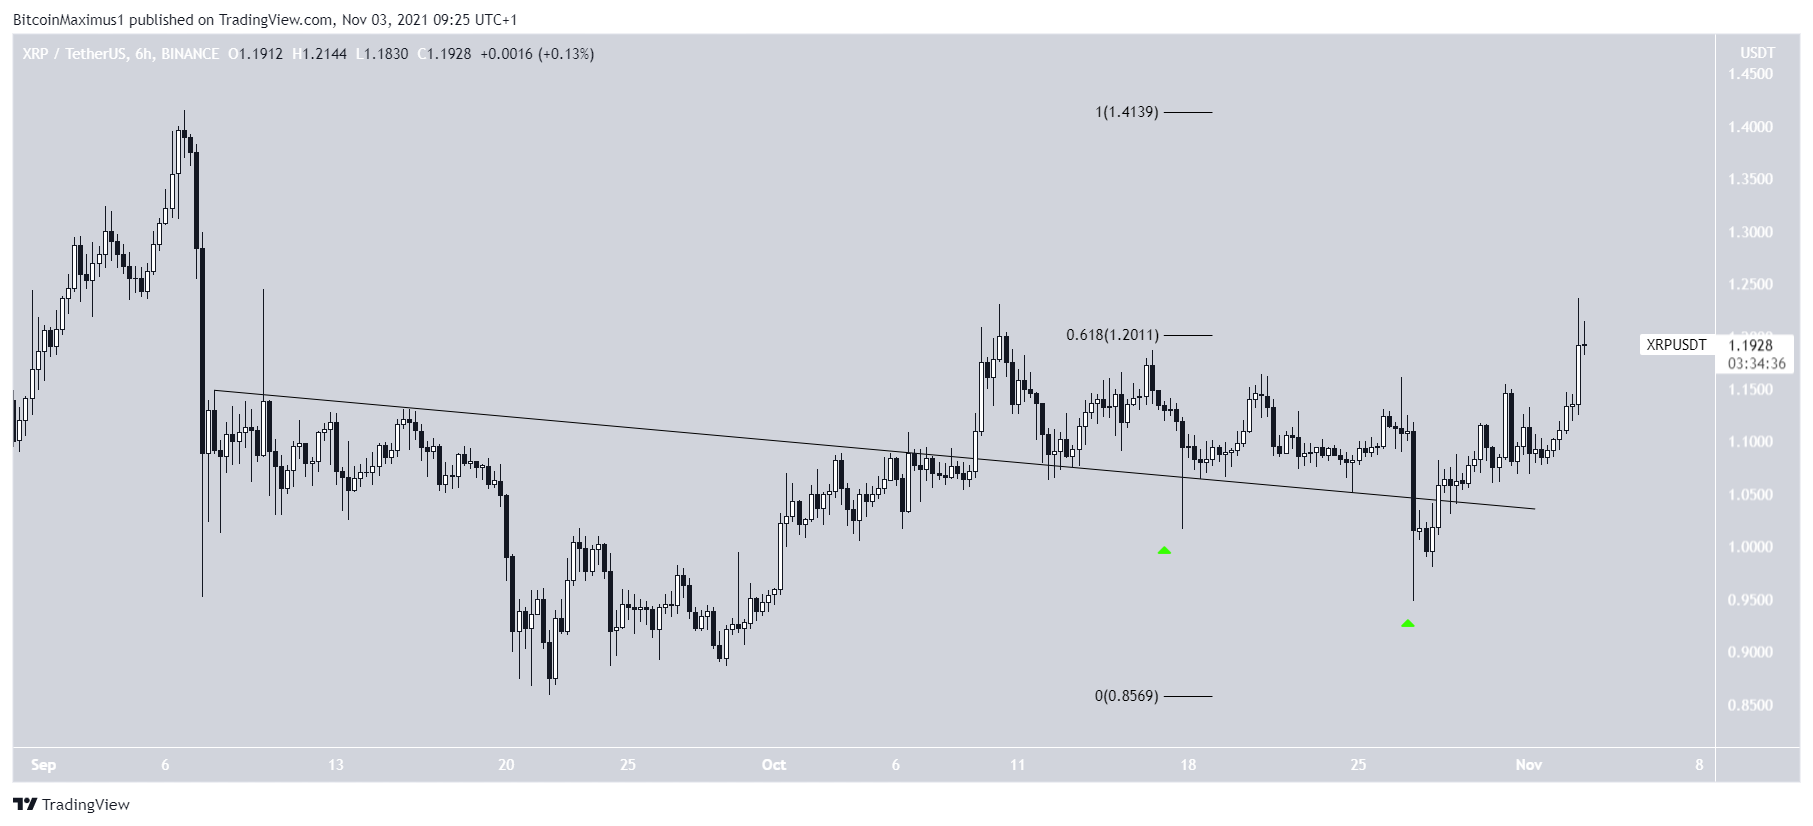
On Oct 9, XRP (XRP) managed to break out from a descending resistance line on Oct 9. However, it was rejected by the 0.618 Fib retracement resistance level at $1.20.
After the rejection, it twice moved below this line, but reclaimed it each time (green icon). The line is now expected to act as support. This is a bullish sign that often leads to significant upward movements.
Currently, XRP is in the process of breaking out above the $1.20 area. If it is successful in doing so, the next resistance would be at $1.41.
DYDX
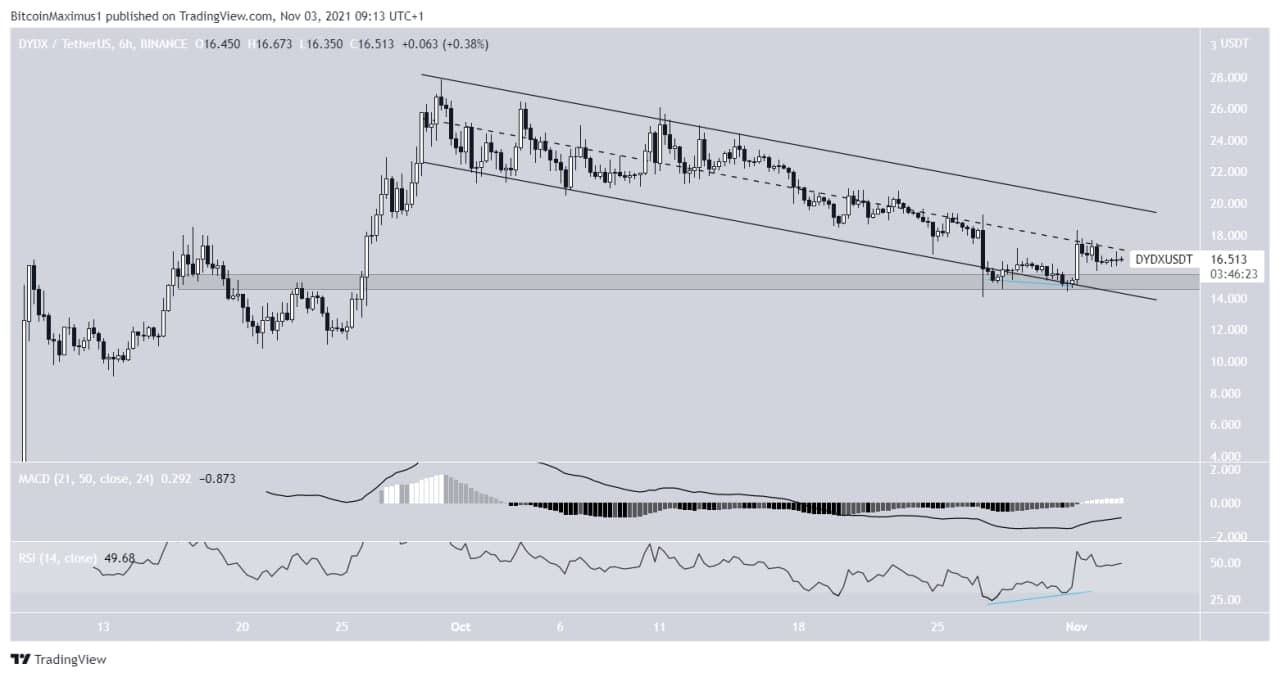
dYdX (DYDX) has been falling since Sept 30, when it reached an all-time high price of $27.85. The decrease has taken the shape of a descending parallel channel, which is usually a corrective pattern. This means that a breakout from the channel would be likely.
In the period between Oct 27-31, the token bounced at the support line of the channel and $14.50 horizontal area. Also, the RSI generated bearish divergence. This is a sign that often precedes upward movements.
Therefore, a breakout from the channel would be likely.
SOL
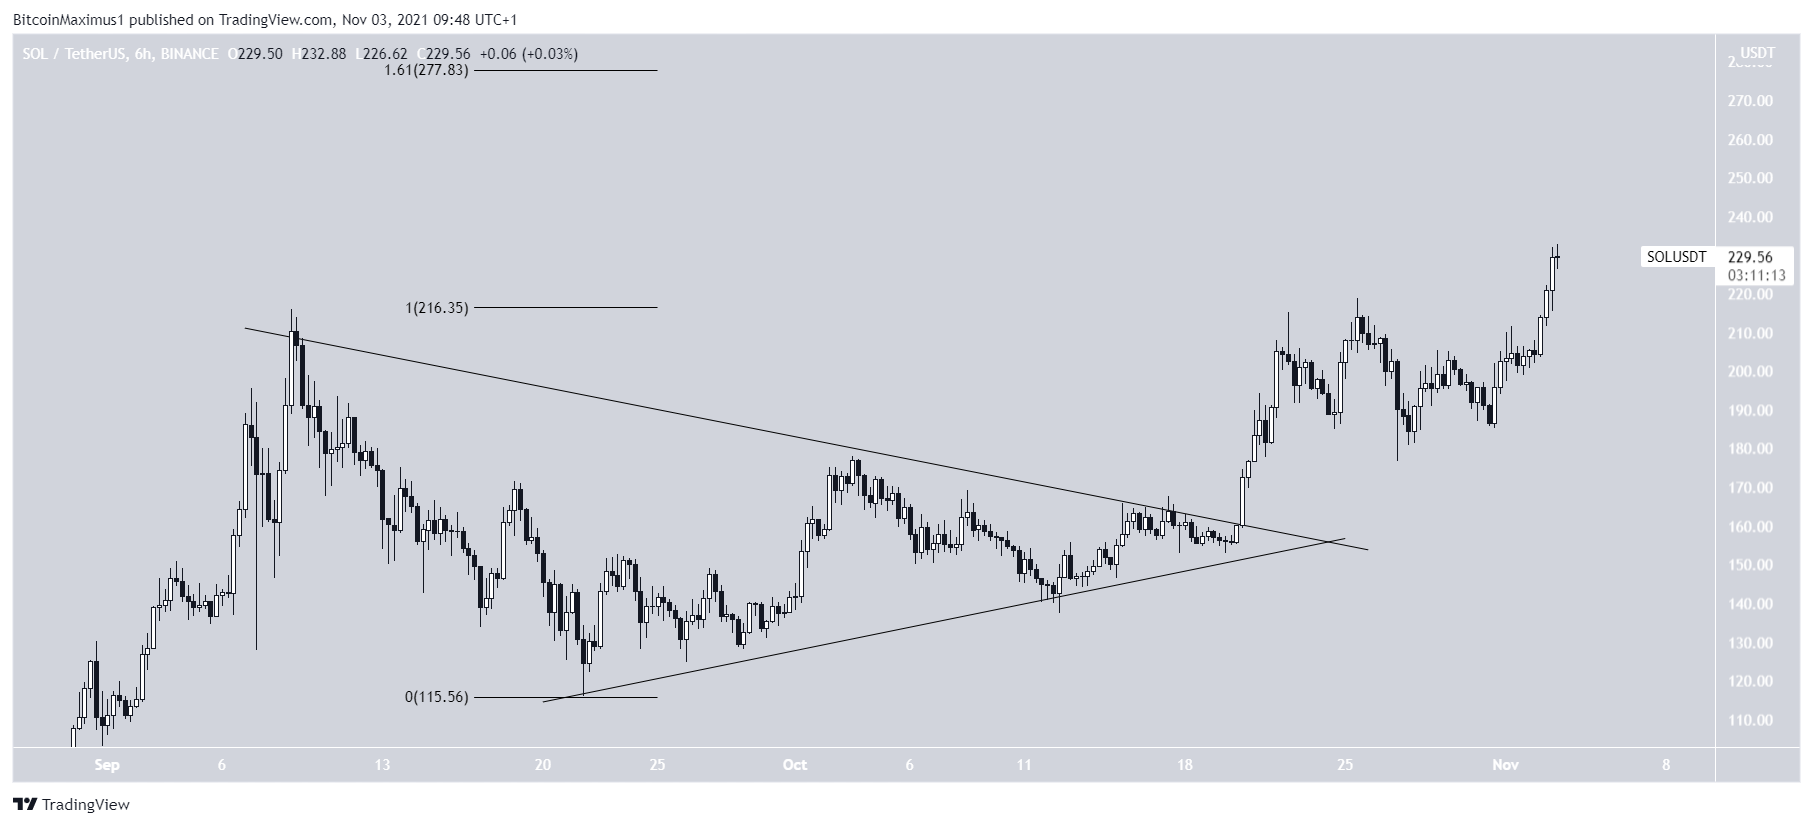
SOL has been increasing since breaking out from a symmetrical triangle on Oct 20.
After being rejected in the period between Oct 20-Nov 1, the token resumed its upward movement. It reached a new all-time high price of $232.88 on Nov 3.
The next closest resistance area is at $278. This is the 1.61 external Fib retracement resistance level when measuring the most recent drop.
PRQ
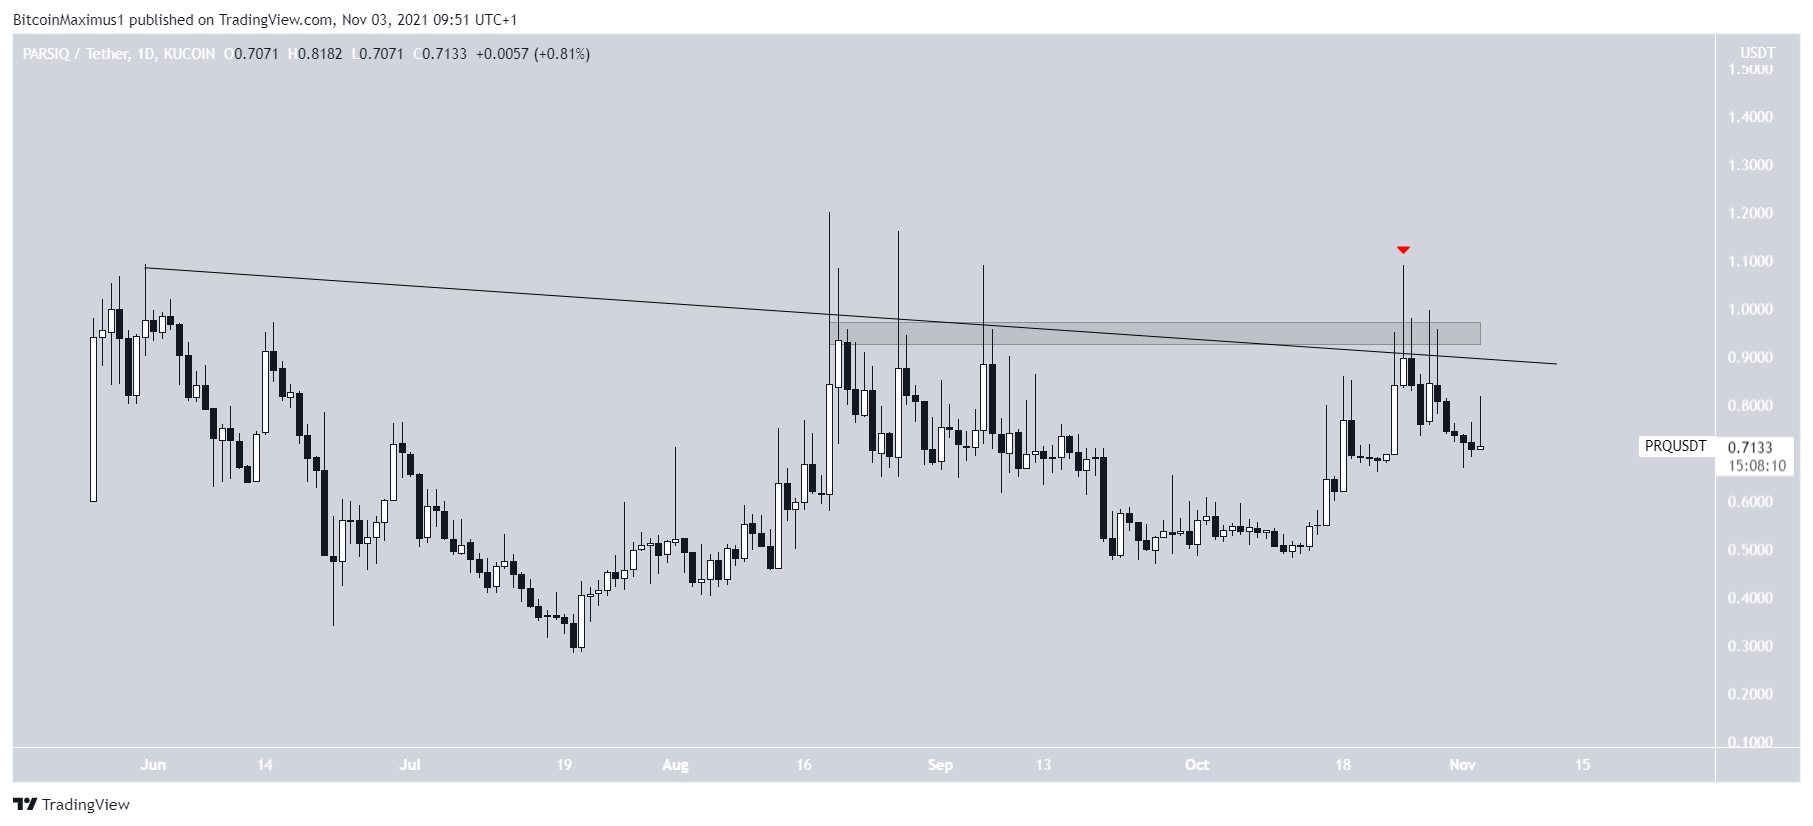
PARSIQ (PRQ) has been decreasing alongside a descending resistance line since May 31. So far, it has made four unsuccessful breakout attempts, more recently on Oct 25 (red icon). They have all created long upper wicks, which are signs of selling pressure.
Furthermore, the rejections have coincided with the $0.95 horizontal resistance area. Until the token breaks out from both the resistance line and this horizontal area, the trend cannot be considered bullish.
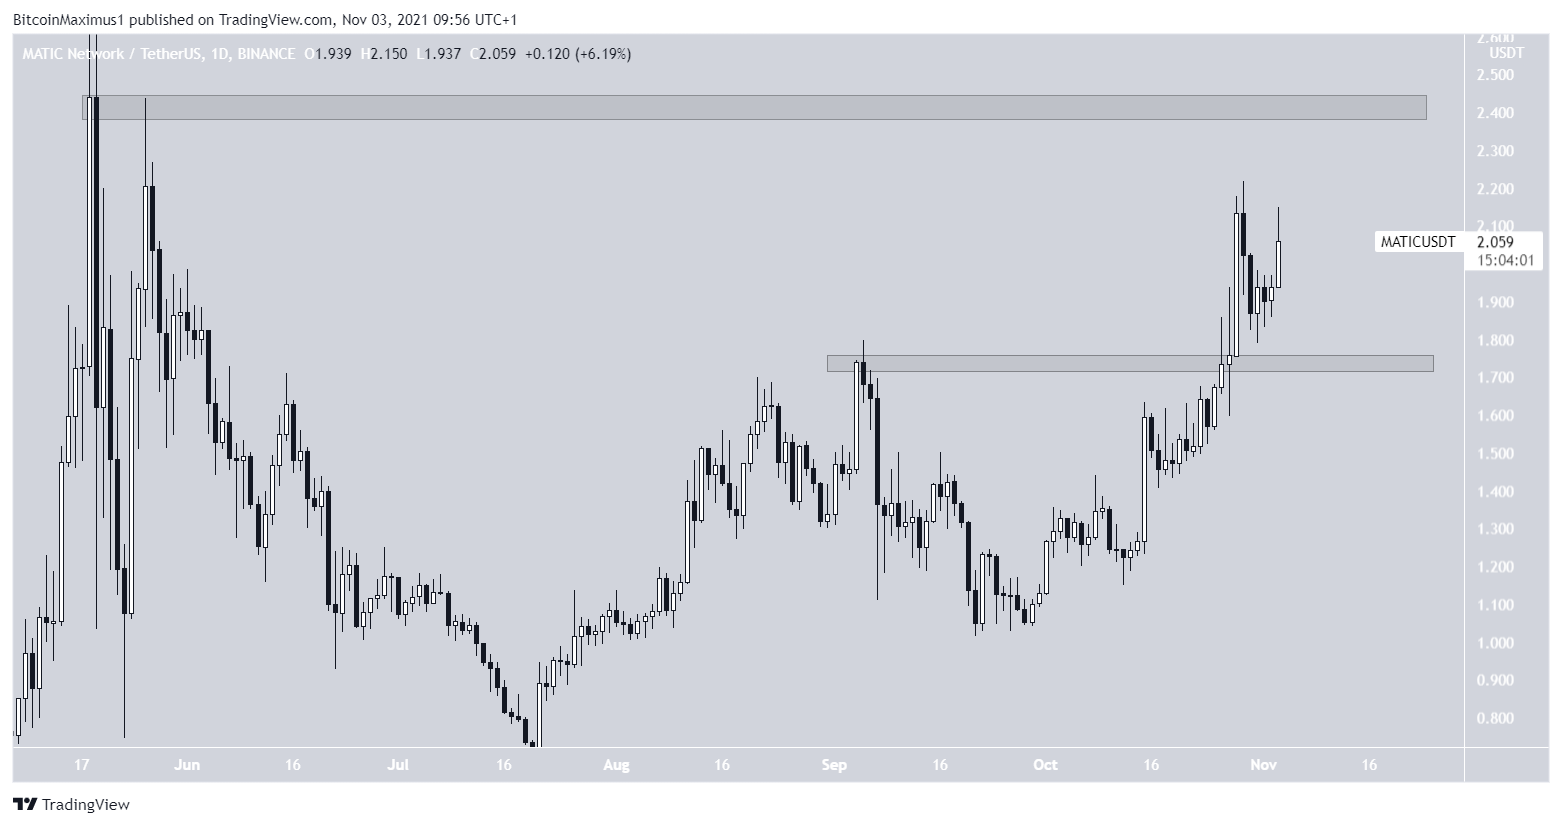
MATIC
MATIC has been moving upwards since Sept 21. On Oct 27, it broke out from the $1.74 horizontal area.
After validating it as support, it resumed its upward movement.
It is now approaching its all-time high price near $2.40.