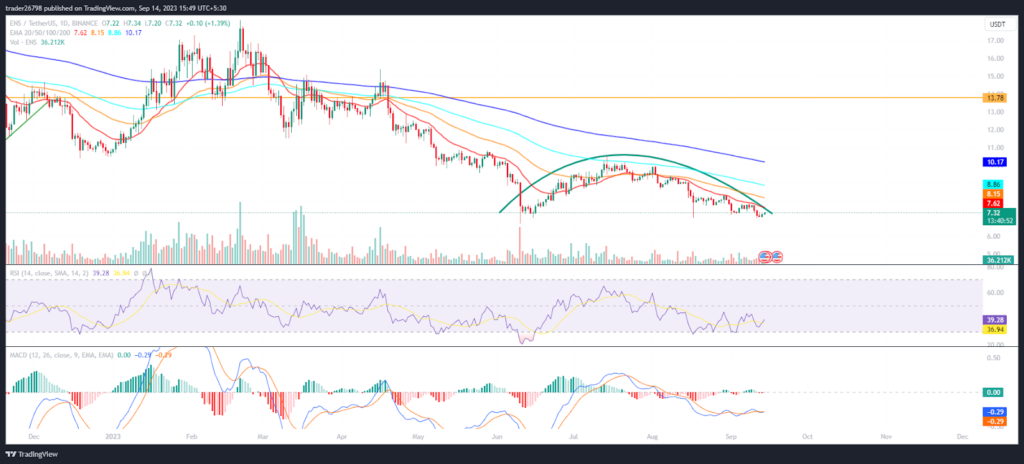
- 1 ENS price shows a bearish chart structure and suggests a short term fall.
- 2 Buyers faced rejection from the 50 day EMA.
Ethereum Name Service (ENS) forms a rounding top pattern and price is near the lower neckline of $7.00 which, if is breached, would lead to a short term fall toward $6.00 in the following sessions. Moreover, ENS indicated seller dominance and short buildup activity, explained by the selling pressure in the past sessions. The bulls were losing strength and failed to surpass the 20 day EMA.
ENS price is trading below the cluster of $8.00 and is hovering near the primary support of $7.00 which is the ideal range for a rebound. Furthermore, buyers are attempting to hold the region and attempting a pullback. However, the technical indicators are giving neutral signals. ENS may recover the gains and will retest the 50 day EMA zone soon.
Ethereum Name Service (ENS) price faced profit booking and lost over 52% gains from the start of 2023 suggesting a downtrend in the past months. However, ENS is now at a make or break level and investors are keeping eyes on the price levels for making new positions. If ENS surpasses the upper trajectory of $8.00, it will head for $9.00, whereas, if it breaks below $7.00, it will retest the demand zone near $5.00.
At press time, ENS price is trading at $7.31 with an intraday gain of 1.21% showing neutrality on the charts. Moreover, the trading volume increased by 2.20% to $5 Million and the pair of ENS/BTC is at 0.000278 BTC. However, the market cap of ENS is $216.98 Million. Furthermore, analysts maintained a sell rating and suggested a negative outlook for the next sessions.
ENS Price Indicates a DownFall On Daily Charts

On the daily charts, ENS price is below the $8.00 cluster suggesting that sellers could smash the $7.00 support and even the $5.00 support level. Moreover, price is trading below the 38.2% Fib zone and is on the verge of the lower bollinger band suggesting a negative outlook for the upcoming sessions.
The RSI curve stayed in the oversold region and showcased a negative crossover and formed a bearish divergence indicating a significant downside for the coming sessions.
The MACD showcased a bullish crossover and forming green bars on the histogram suggests neutral chart structure.
Summary
Ethereum Name Service (ENS) price is trading below the 20 day EMA and forms a rounding top pattern that showcased bearishness on the charts. Moreover, the price action suggests a significant downside toward the demand zone of $5.00 which sellers are willing to register and persist in creating selling pressure for the past sessions.
Technical Levels
Support Levels: $7.00 and $5.80
Resistance Levels: $8.00 and $8.80
Disclaimer
The views and opinions stated by the author or any other person named in this article are for informational purposes only and do not constitute financial, investment, or other advice. Investing in or trading crypto or stocks comes with a risk of financial loss.
 thecoinrepublic.com
