- 1 Filecoin price (FIL) surged 1.53% in the last 24 hours and is currently trading at $3.19.
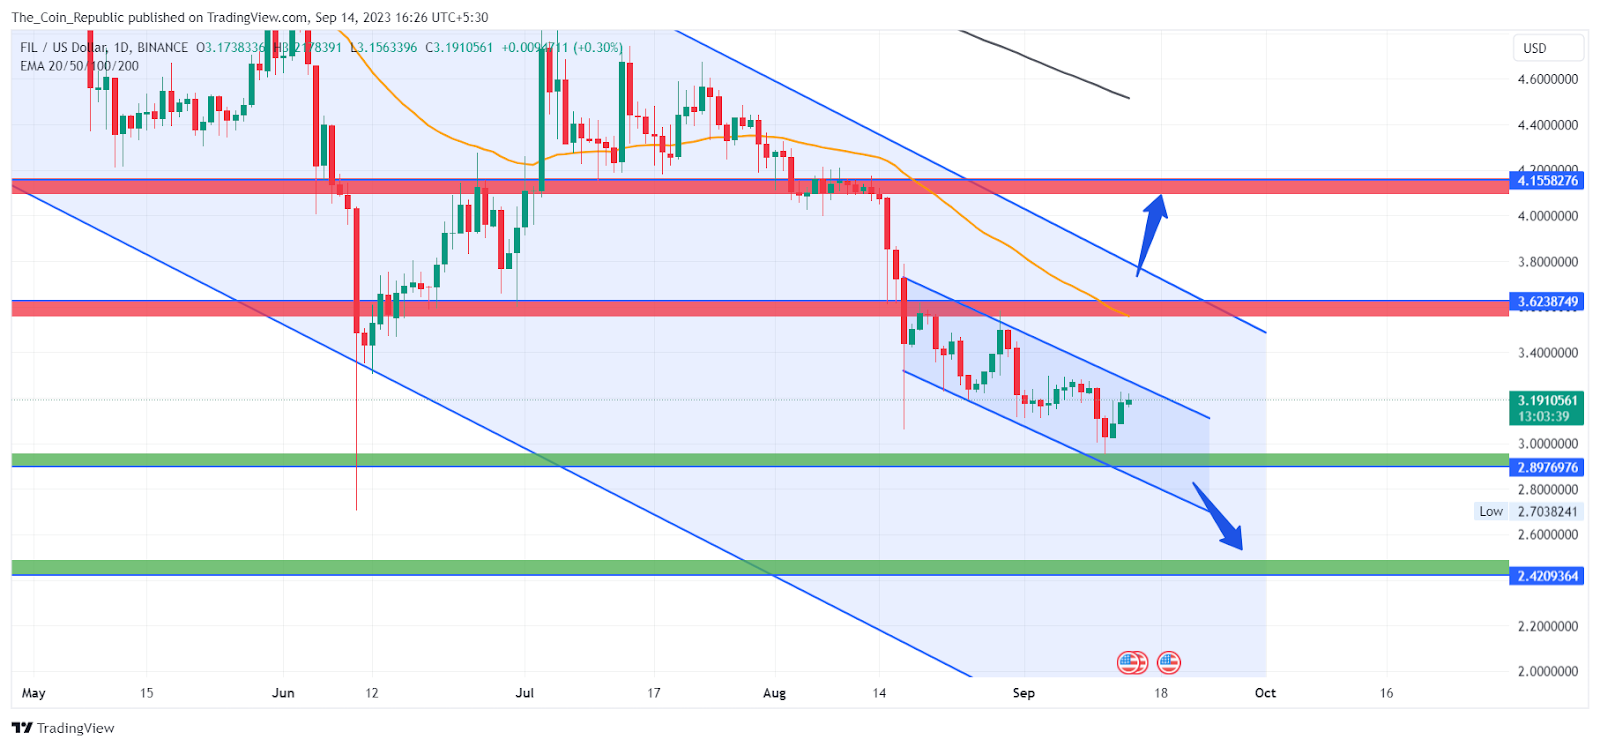
- 2 Filecoin crypto price (FIL) is declining by forming a channel pattern over the daily chart.
The FIL crypto price has been in a continuous declining trend losing the gains and continuing with the further decline forming an interesting channel pattern. The price is in a continuous decline after a short-term surge in February 2023. Since then, the price has wiped out approximately 50% in the last 6 months and more than 20% declined in the last month.
FIL crypto price has been rolling between the upper and lower boundary of the channel pattern and declining. The daily chart shows that the price slumped below the key moving average of 50 and 200 EMA. The FIL chart also witnessed a death crossover on the charts.
Recently, the price consolidated near the previous swing low waiting for buyers to accumulate and defend the swing low. The failure of the FIL price caused a breakdown of the support at $4 and declined to the lower levels.
Filecoin (FIL) is a decentralized and open-source platform that allows developers to create cloud file storage services like Dropbox or iCloud. Filecoin uses its own blockchain and token to run the network and reach consensus.
Filecoin Price Prediction Using Price Action Strategy

The FIL price might decline to the lower support zones as the bears are currently dominating. The price could not sustain above the key moving average of 50-day EMA indicating bearishness in the crypto in the short term.
The FIL crypto volume analysis shows that the volume received is less than the average volume indicating the weakness in the market. The FIL token has received a $95.8 Million volume in the past 24 hours which is nearly 11.13% less than the last day. The FIL price may keep sliding down until it gets enough buyers to consolidate at the lower levels and counter the selling pressure.
FIL Price Forecast: What the Indicators are Showing?

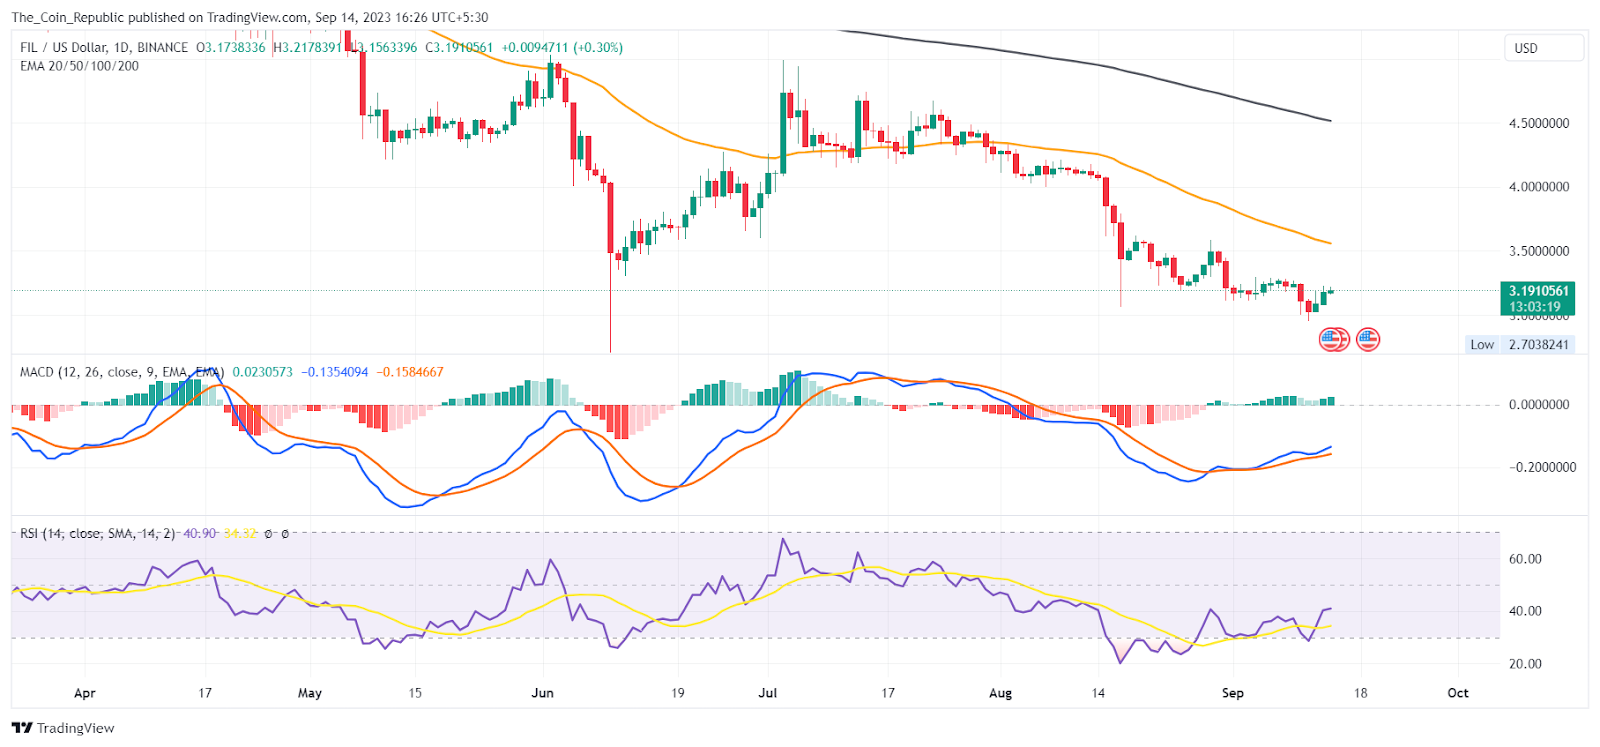
As per the EMA analysis, the FIL price could not sustain above the 50 and 200-day EMA indicating bearishness over the daily charts.
RSI is trying to recover after entering an oversold region indicating the dominance of sellers in the market at the moment. MACD lines have made a bearish crossover. Histogram bars are being formed below the mean line with decreasing height indicating that the bearish trend may continue to prevail in the short term.
Conclusion
The FIL crypto price is following a bearish channel pattern and has fallen below the 50 and 200 EMA. The price dropped by 50% in six months and by 20% in one month. The price broke down the support of $4 and may decline further.
Technical Levels
- Support levels: $2.89 and $2.42
- Resistance levels: $3.62 and $4.15
Disclaimer
The views and opinions stated by the author, or any people named in this article, are for informational purposes only and do not establish financial, investment, or other advice. Investing in or trading crypto or stock comes with a risk of financial loss.
 thecoinrepublic.com
