KCS is the native token of KuCoin, which was launched back in 2017 as a profit-sharing token that allows traders to draw value from the exchange. KCS Bonus is regarded as one of the best ways to get passive income. Users who hold more than 6 KCS can get a daily dividend, which comes from 50% of KuCoin's daily trading fee revenue. It was launched on September 15, 2017. The company was originally co-founded in 2013 by the following people: COO Eric Don, marketing director Jack Zhu, president of business operations John Lee, operations and maintenance director Kent Li, chief legal consultant Linda Lin, CEO Michael Gan, and CTO Top Lan.
Let us look at the technical analysis of KCS.
Past Performance
KCS opened on 19 October 2021 at $12.89. The week witnessed a continuation in the uptrend, after which it closed yesterday at $17.89. This was a positive weekly change of 38.7%
Source: https://www.tradingview.com/x/zChK7EMY/
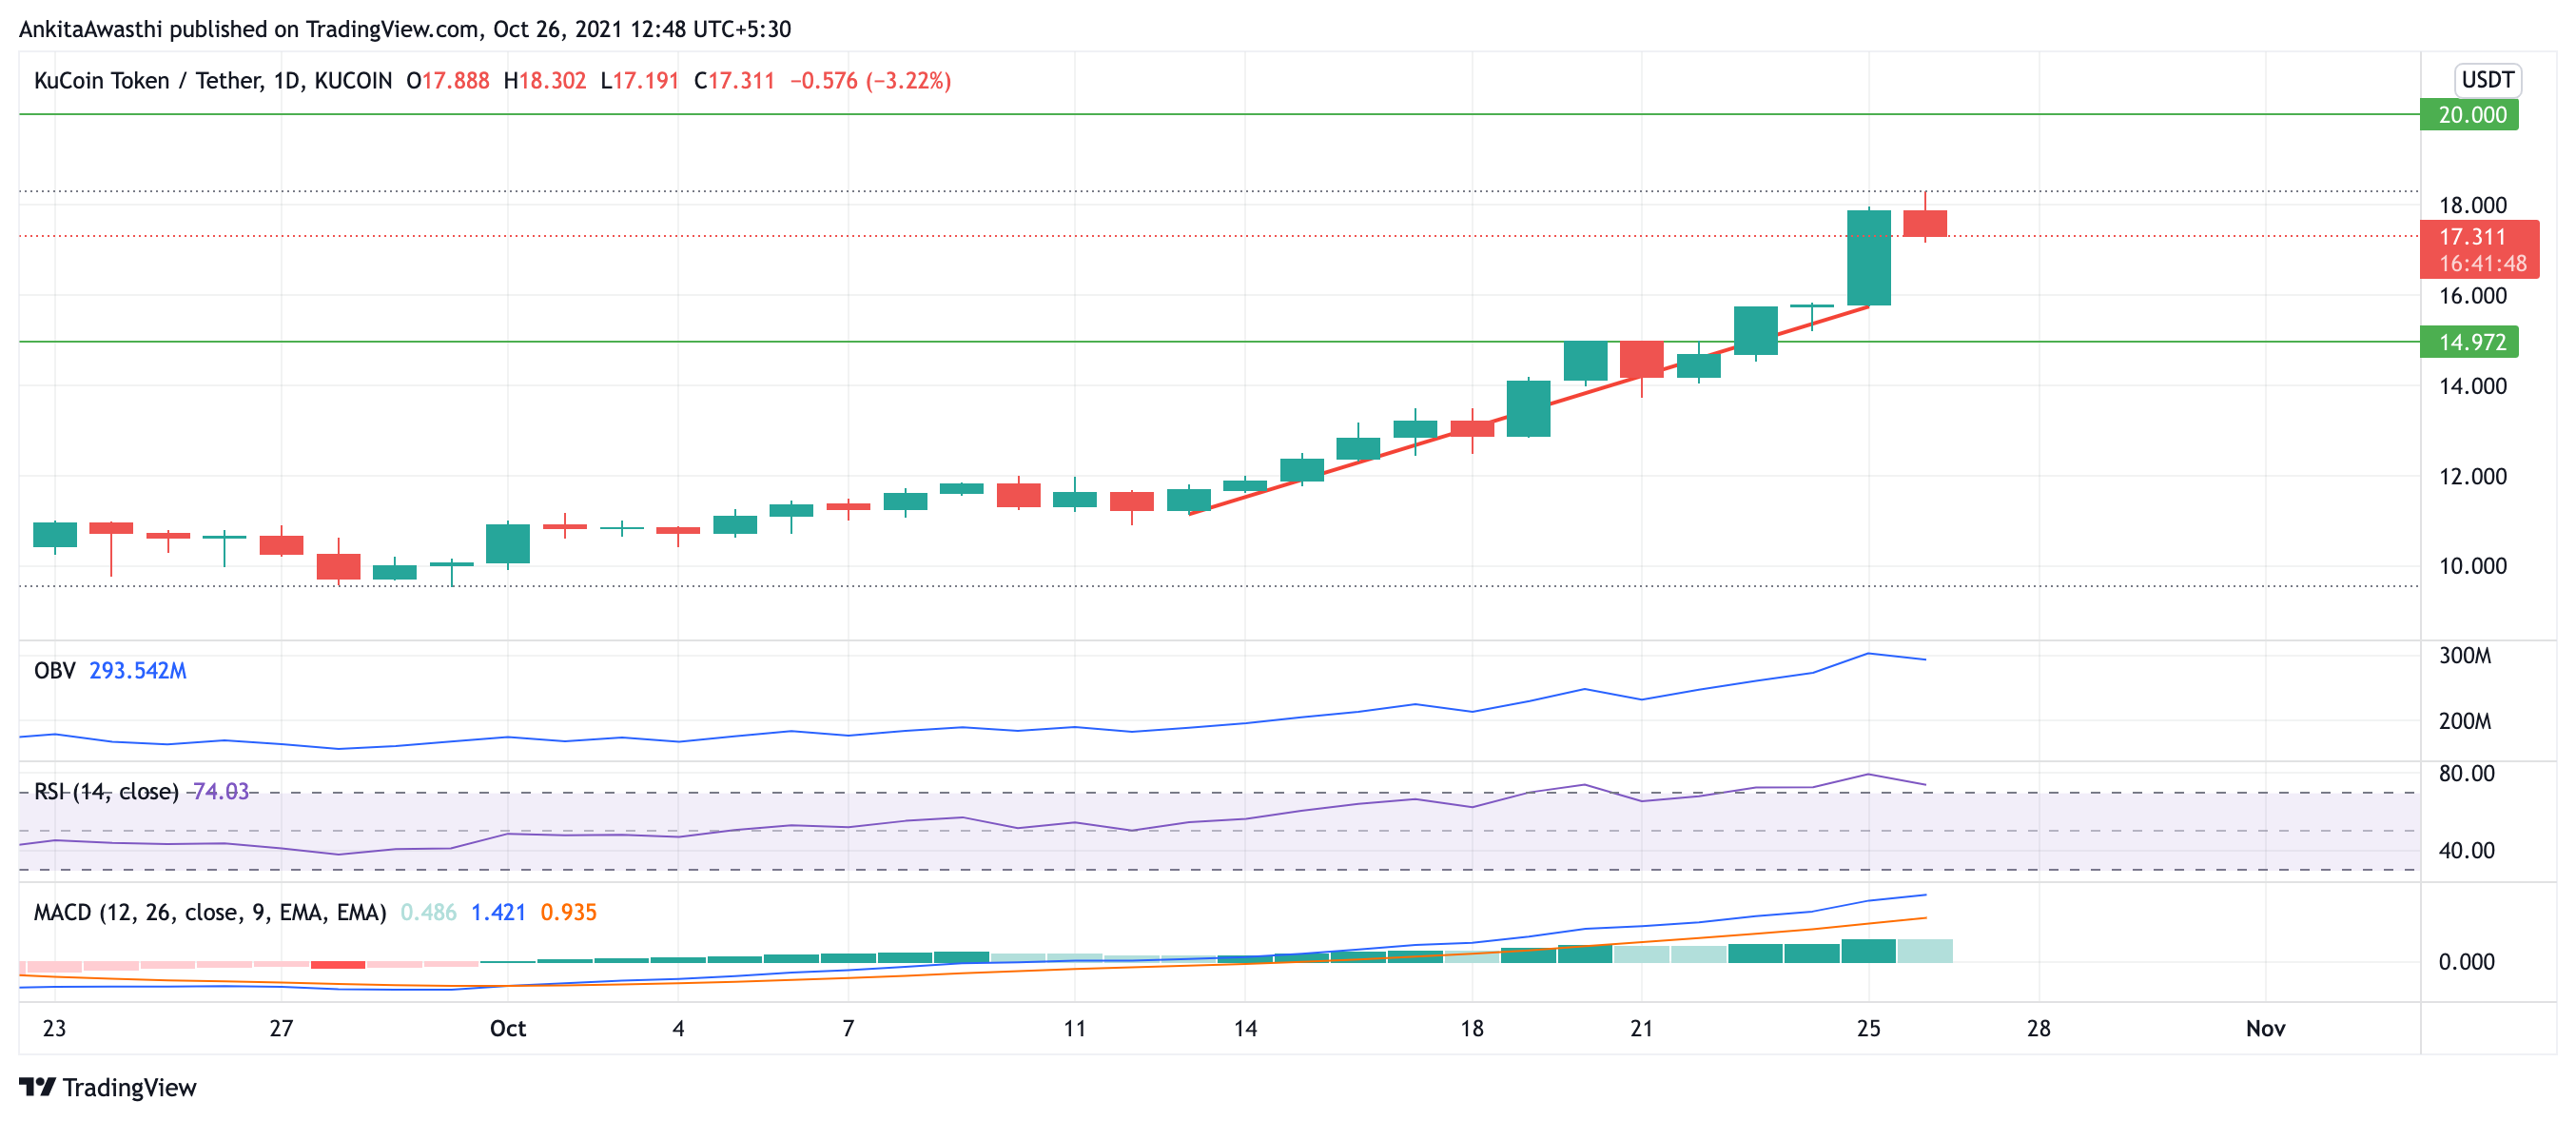
KCS Technical Analysis
The uptrend can be seen to be continued over the past week. Higher highs and higher lows were seen across the week. The current trading price of KCS is $17.32 which is 3.121% down as compared to yesterday. This can be a negative signal.
OBV is showing a hill at the end of its graph, which can be a negative signal. However, there is no significant change. Hence, the traders may hold their current positions.
RSI is at 74.09%. This is a positive signal and the traders may take a long position here. However, it is in the overbought region and a slight decline can also be seen at the end of the graph. This can be a signal that the trend may reverse itself.
MACD, being a lagging indicator, is confirming the uptrend. This can be seen as the height of the histogram is increasing. Also, the fast line and the slow line are moving upwards. There is no divergence of the MACD graph from the price chart.
Day-Ahead and Tomorrow
Fib numbers show that the KCS price chart has crossed the Fibonacci pivot point at $14.92. The next pivot point is at $18.51.
Thus, the indicators are giving mixed signals. The traders may hold their current positions while keeping the stop-loss at $14.972. They can keep the target at $20.