Polkadot is an open-source sharding multichain protocol that facilitates the cross-chain transfer of any data or asset types, not just tokens, thereby making a wide range of blockchains interoperable with each other. Polkadot was founded by the Web3 Foundation, a Swiss Foundation founded to facilitate a fully functional and user-friendly decentralized web, as an open-source project. It is a sharded multichain network, meaning it can process many transactions on several chains in parallel (“parachains”). This parallel processing power improves scalability. Let us look at the technical analysis of DOT.
Past Performance
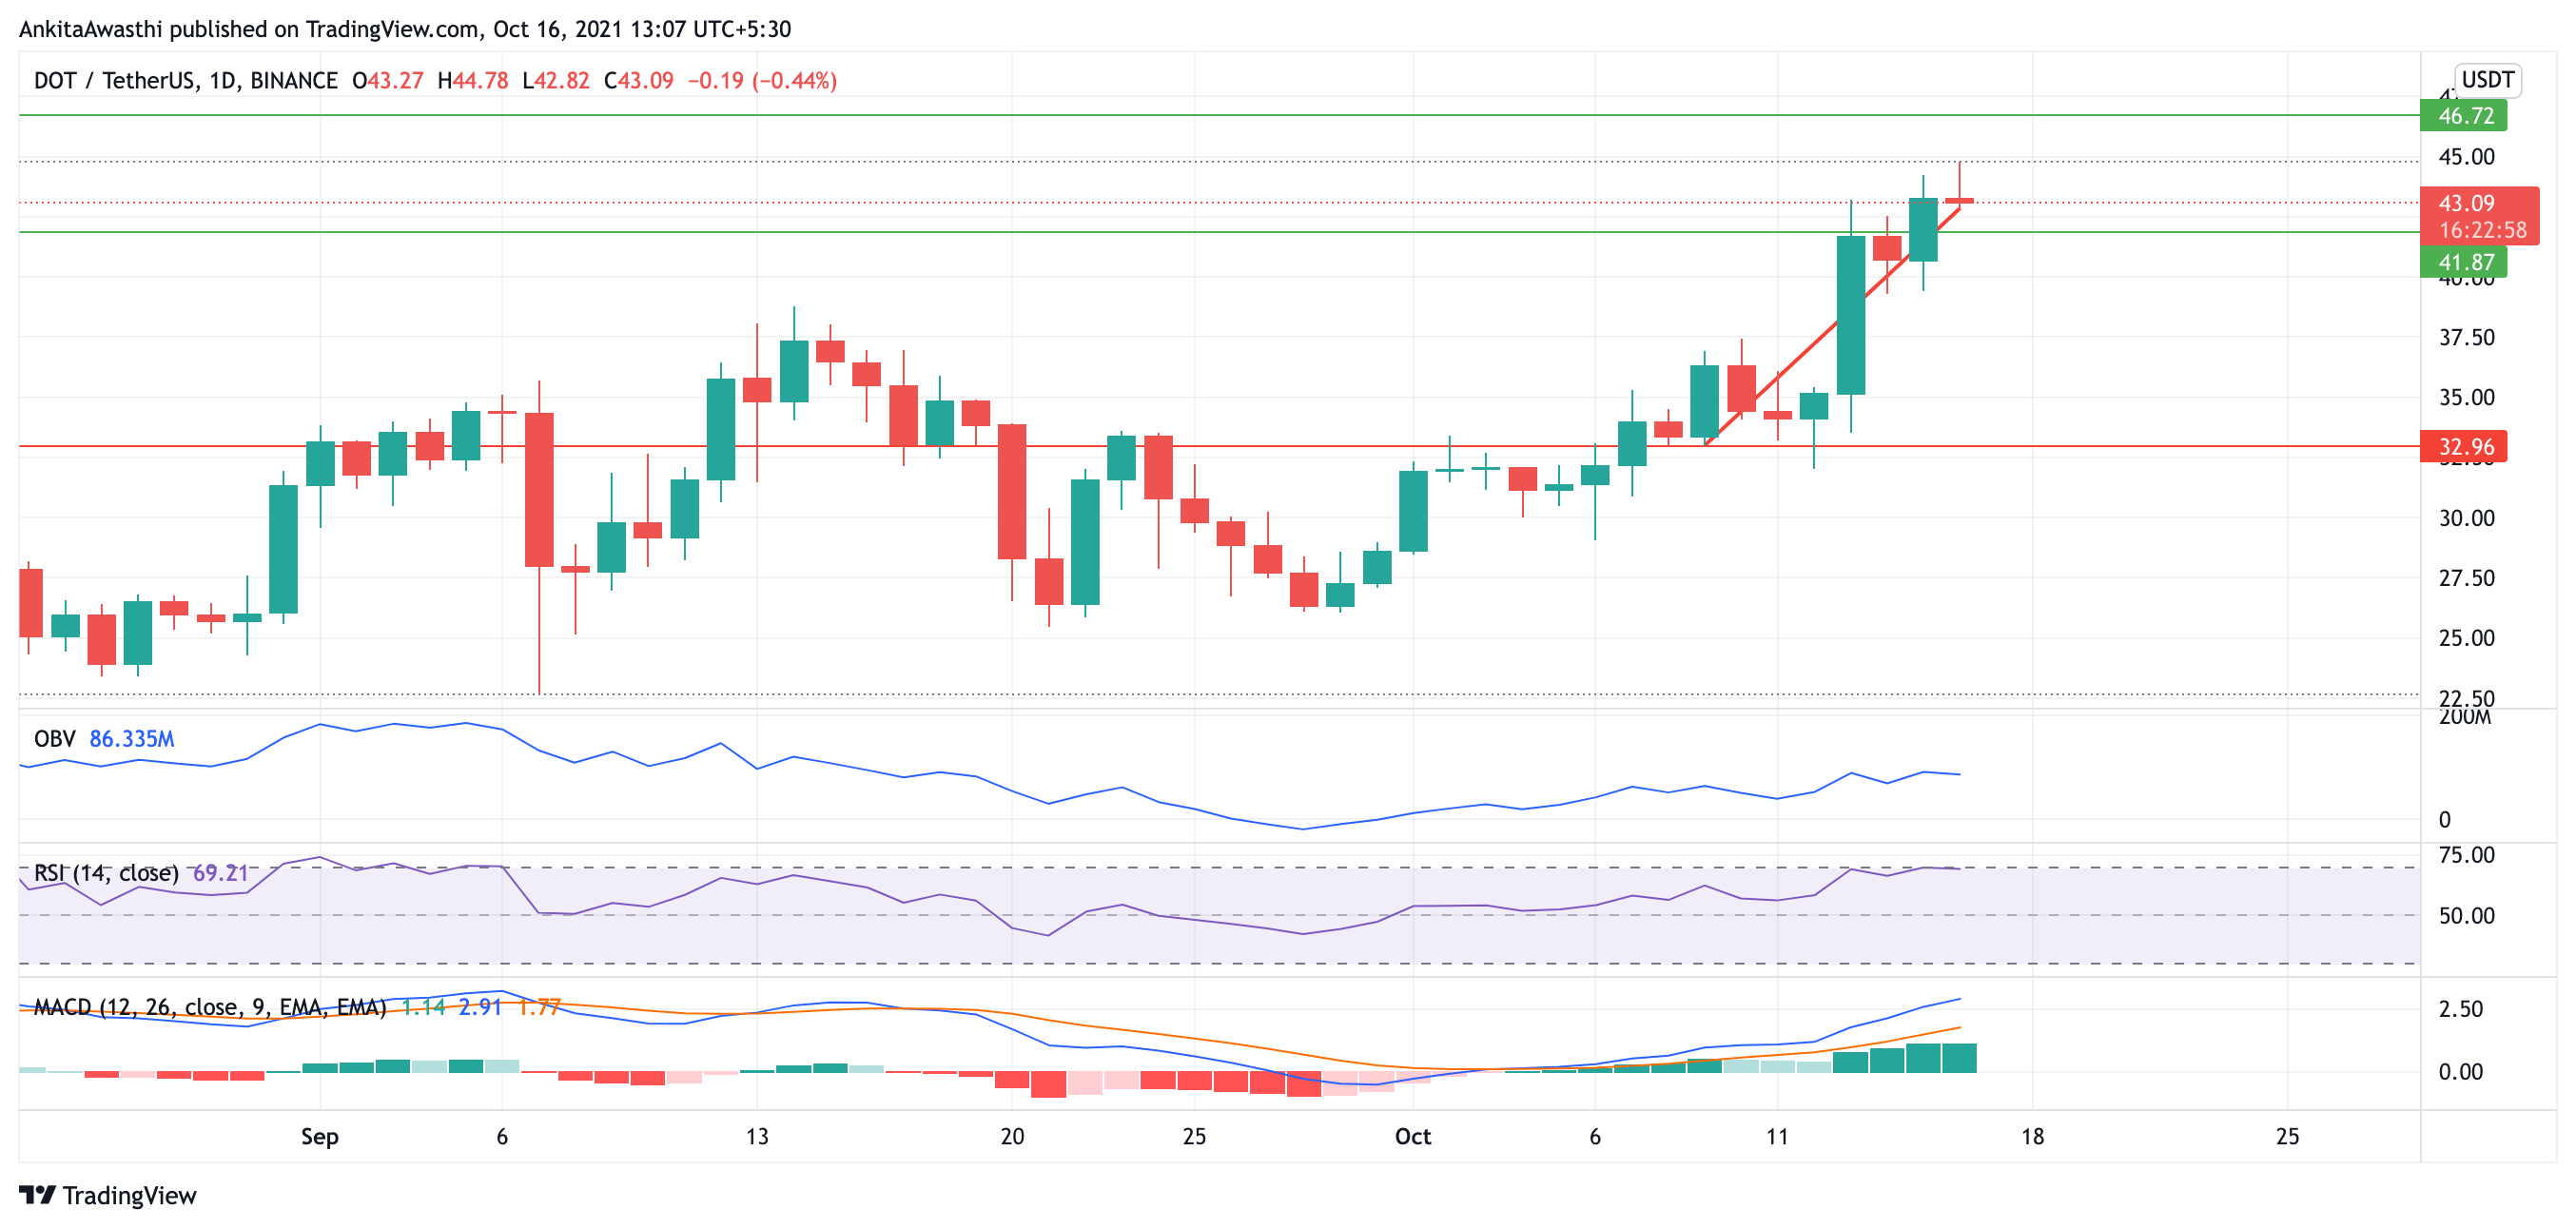
The DOT opened at $33.31 on 09 October 2021. The witnessed a strong uptrend, after which it closed on 15 October 2021 at $43.16. It was an overall change of 29.6%.
Source: https://www.tradingview.com/x/lSE8j0N4/
DOT Technical Analysis
The price took support at the $32.96 level, after which there was an uptrend. It is likely for the uptrend to continue. Currently, DOT is trading at $43.09 which is 0.44% down as compared to yesterday’s close.
OBV is showing an uptrend which means that the buying pressure is greater than the selling pressure. This is a bullish signal and traders may take a long position here.
RSI is close to the boundary of the overbought region. It is currently at 69.21%. Traders may need to be careful as the trend may reverse itself after entering the overbought region. However, this is not a bearish signal but a bullish one. Traders may take a long position.
MACD is confirming the last week’s uptrend by being a lagging indicator. The distance between the fast line and the slow line can be seen increasing. Both the lines are in the positive direction and there is no divergence from the price chart.
Day-Ahead and Tomorrow
The price chart has successfully crossed the fib level at $38.77. The next fib target is at $46.97.
Thus, the indicators are more on the bullish side. The traders may take a long position by keeping the target at $46.72 and the stop loss at $41.87.