- 1 NEO coin price showed a fall and slipped below the 20-day EMA.
- 2 Buyers are loosening the gains and staying cautious from the past sessions.
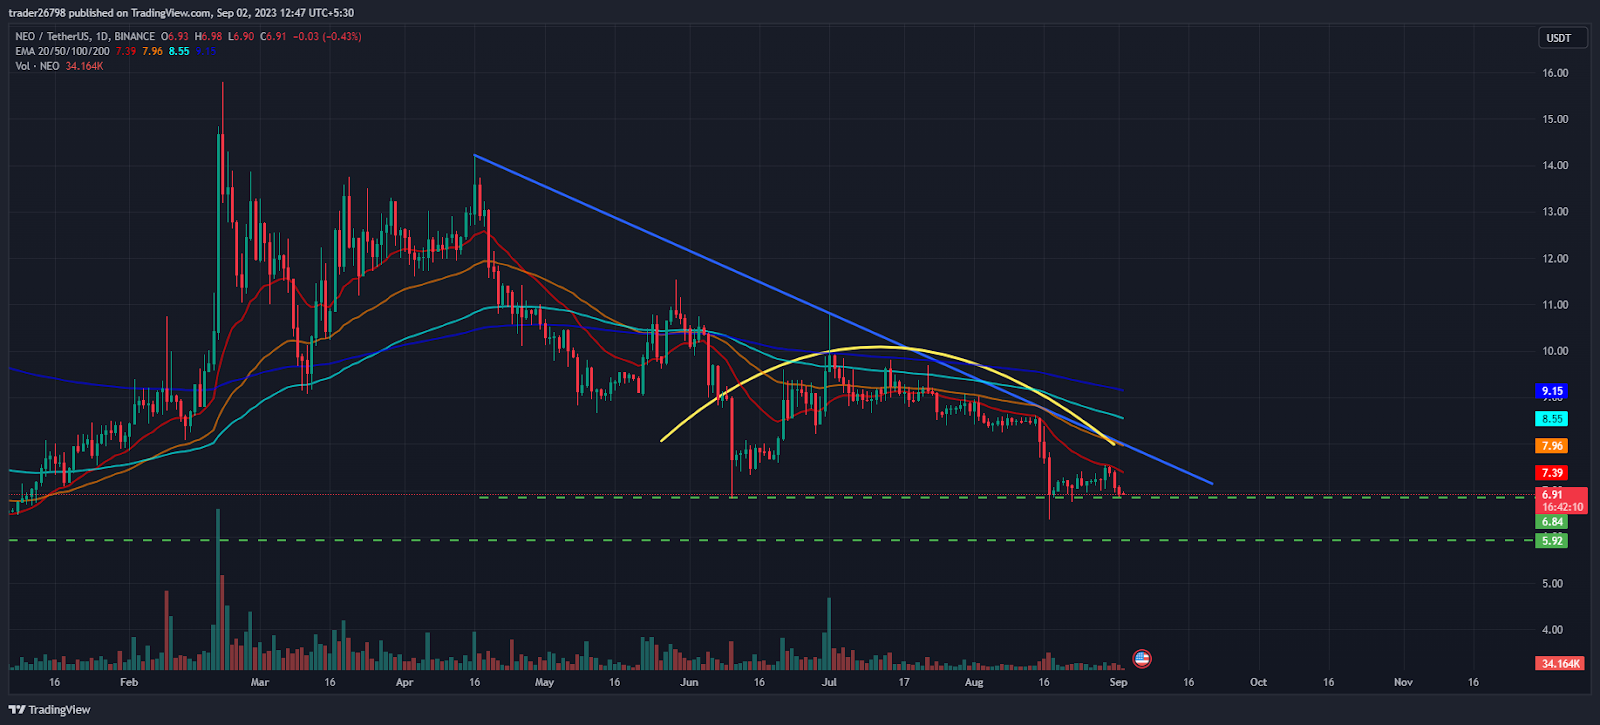
NEO coin faced selling pressure, and the price headed to the primary support of $7.00, where buyers tried to halt the gains and attempted a pullback to retain the 20-day EMA. Moreover, the NEO coin shows a rounding top pattern, which signals a bearish chart structure and indicates seller control on the charts.
Furthermore, the bulls faced rejection multiple times from the upper trendline and continued to form lower highs and lower lows, gradually felling, and retesting the swing of $7.00. Buyers must register a reversal and surpass the trendline to retain the uptrend.
The NEO coin chart structure suggests buyers are under pressure and persist in unwinding their long positions because of the fall from the past sessions. Conversely, sellers continued making short positions and tried for a subsequent drop toward $6.00, followed by $5.50.
NEO coin price action shows seller dominance and indicates a significant resistance near $10.00, where bulls tried to surpass multiple times and faced a throwback. Moreover, the 200-day EMA acted as a resistance and did not surpass it yet. Furthermore, the coin persists in a downtrend, and slow and steady, it crashes the immediate support ranges.
At press time, the NEO coin price is trading at $6.91 with an intraday drop of 0.40%, showing bearishness on the charts. Moreover, the trading volume increased by 3.89% to $19.05 Million, and the pair of NEO/BTC is at 0.000270 BTC. However, the market cap of NEO coin is $491.56 Billion. Furthermore, Analysts maintained a sell rating and indicated a negative outlook for the upcoming sessions.
NEO Price Action on Daily Charts

On the daily charts, the NEO coin price shows a downtrend and persists in a fall for the past months. Moreover, the price is hovering near the crucial support range, and buyers try to absorb the selling pressure and attempt a pullback.
Moreover, the NEO coin price is trading near the 23.6% Fib level and on the verge of the lower Bollinger band, showing bears’ grip and a negative outlook on the charts.
NEO Coin Shows Seller Dominance On Short Term Charts

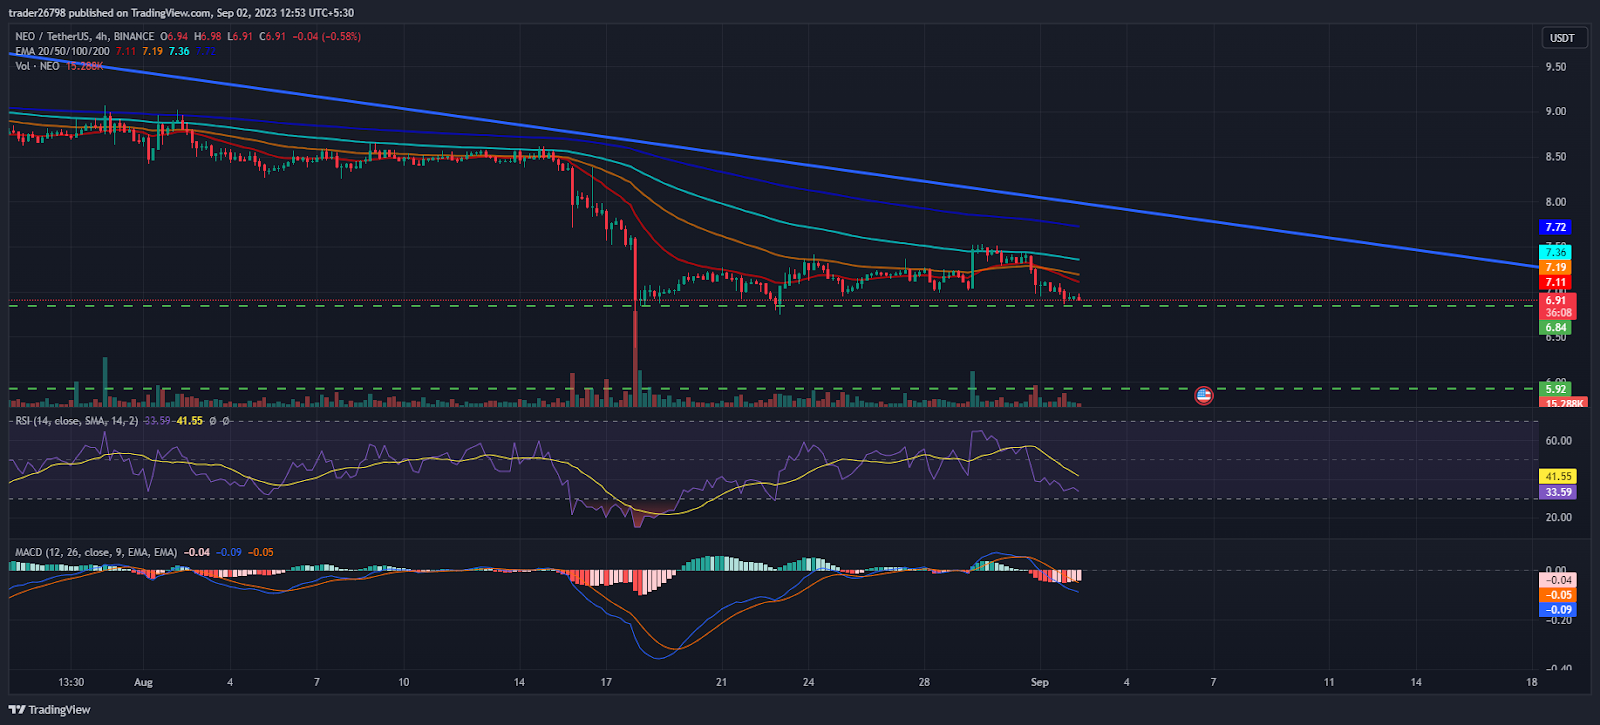
On the 4-hour charts, the NEO coin price shows a volatile chart structure hovering near the cluster of $7.00. However, buyers are trying for a pullback to retain the 20-day EMA.
The RSI curve stayed in the oversold region, showing a bearish divergence and a negative crossover, showing selling pressure on the charts.
The MACD indicator showed a bearish crossover, and forming red bars on the histogram shows a negative outlook and suggests a follow-on selling may arise toward the trajectory of $6.00.
Summary
NEO coin price shows a bearish chart structure and indicates a negative outlook for the past sessions, trading below the key moving averages. Moreover, the bears persisted in making short positions and tried for a further fall toward the demand zone of $6.00. The upper trajectory is near $8.00, which needs to be surpassed to extend the momentum, whereas the lower trajectory is near $6.00, which must be preserved.
Technical Levels
Support Levels: $6.00 and $5.70
Resistance Levels: $8.50 and $10.00
Disclaimer
The views and opinions stated by the author or any people named in this article are for informational purposes only, and they do not establish financial, investment, or other advice. Investing in or trading crypto or stock comes with a risk of financial loss.
 thecoinrepublic.com
