- 1 ICP crypto price showed a double bottom pattern and is looking for a rebound.
- 2 Buyers are attempting a pullback to surpass the hurdle of 20-day EMA.
ICP crypto price is hovering near the crucial support showing a double bottom pattern and is looking for a pullback to surpass the 200-day EMA. Bears gained their strength and continued to outperform, resulting in the selling pressure from the past trading sessions, and the token slipped below the significant moving averages.
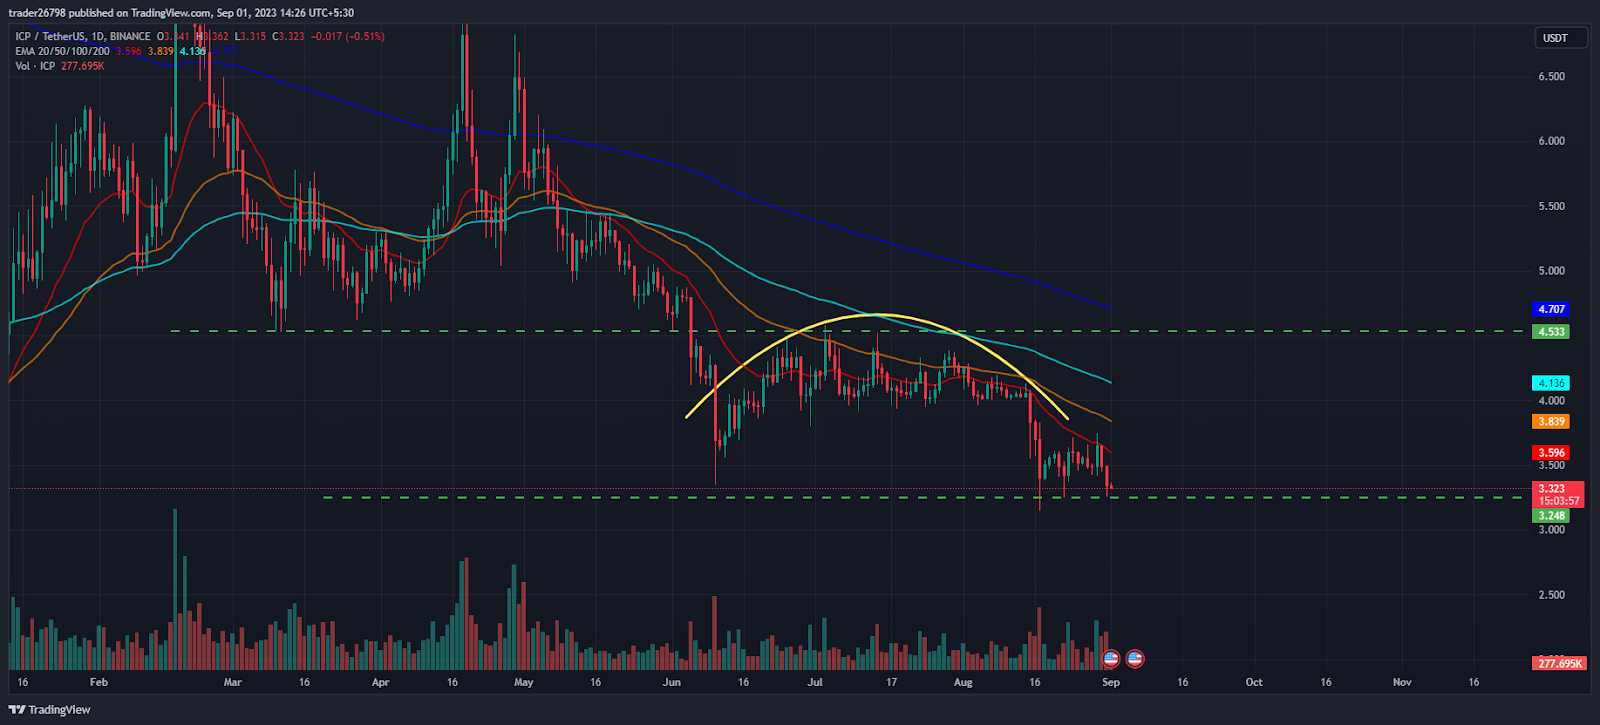
Moreover, the ICP crypto price trades near the demand zone and expects a short-term bounce toward $4.000. Furthermore, the fall is due to the rounding top pattern, and the token slipped below the neckline of $3.800, showing a breakdown on the charts.
ICP crypto chart structure shows that the price is near the demand zone, indicating that the downside is limited and capped at $3.00, whereas the upside, if it surpasses $3.600, can stretch toward $4.00, followed by $4.500 in the upcoming sessions. Furthermore, the sellers have started covering their positions, suggesting that the fall is near an end.
The trajectory of the ICP crypto price indicates that the post-breakdown price is consolidating in a range and does not break its support of $3.30, suggesting that buyers persist in trying and attempting a pullback. However, the battle still favored the sellers because of the price action, which indicates short buildup activity and the token persisted in breaking multiple supports for the past months.
At press time, ICP crypto price is trading at $3.324 with an intraday drop of 0.28%, showing neutrality on the charts. Moreover, the trading volume increased by 1.54% to $24.85 Million, and the pair of ICP/BTC is at 0.000128 BTC. However, the market cap of ICP crypto is $1.48 Billion. However, Analysts maintained a sell rating and expected a significant fall in the following sessions.
Will ICP Attain Reversal Above $3.500?

On the daily charts, the ICP crypto price is near $3.30, where strong support is there, and sellers have tried their best but failed to break, and price action suggests a reversal toward $3.800 followed by $4.00 in the subsequent sessions.
Moreover, the ICP price is trading near the 23.6% Fib level and below the mid-Bollinger band, showing bearishness on the daily charts. Furthermore, the price action shows that sellers remained active and buyers stayed cautious for months.
ICP crypto, if it surpasses the 20-day EMA, will gain strength, try to catch $3.80, and head toward the neckline of $4.00. Conversely, if the price breaks below $3.30, it will reach the round mark of $3.00.
What Technical Indicator Says?

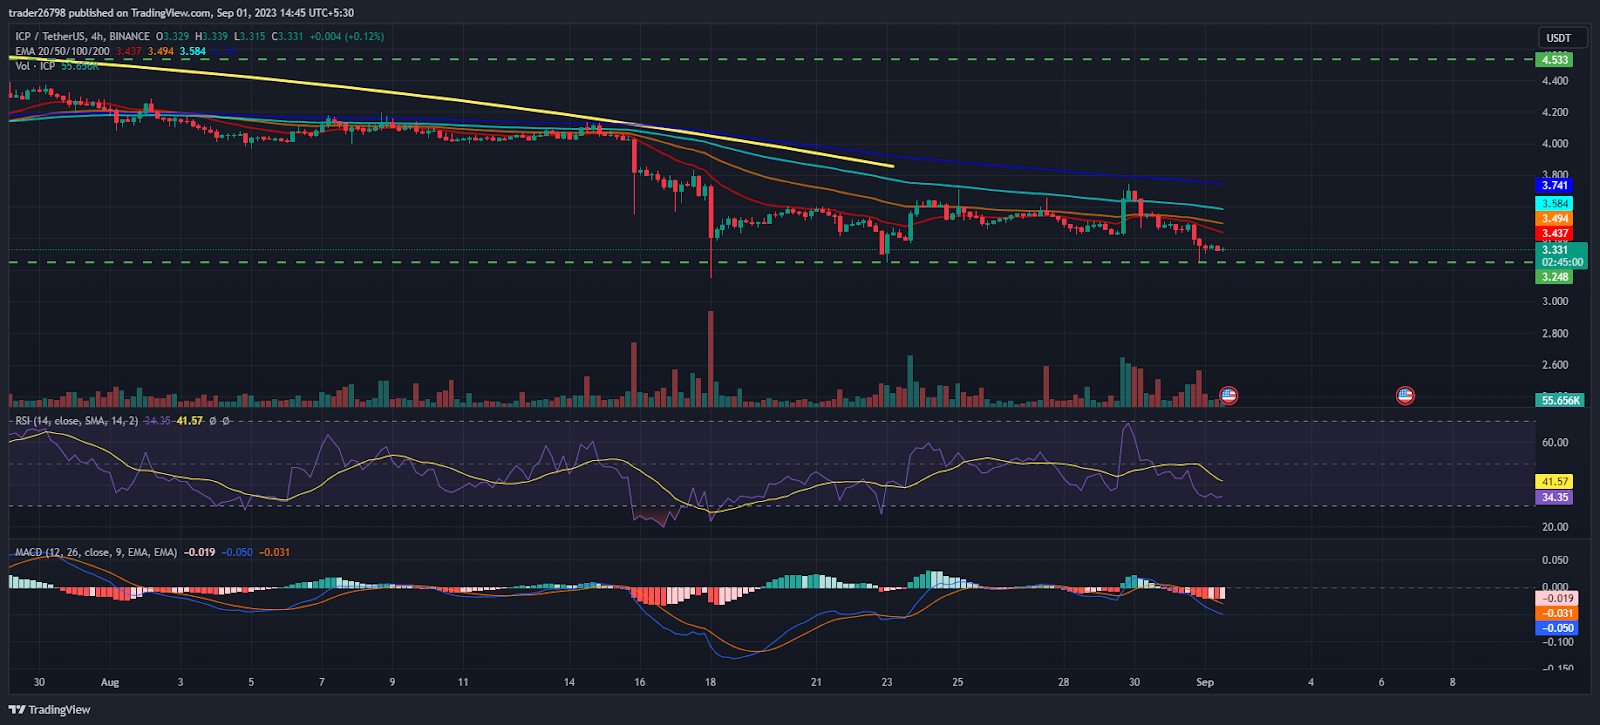
On the 4-hour charts, the ICP crypto price shows a downtrend and has made lower highs for the past sessions. Furthermore, the token cannot surpass the upper trendline and faces rejection multiple times, showing sellers’ control on the charts.
The RSI curve stayed in the oversold region, and showing a bearish divergence indicates a negative outlook on the charts.
The MACD indicator showed a bearish crossover and persistence in forming red bars on the histogram, showing selling pressure and underperformance on the charts.
Summary
ICP price is at a crucial support of $3.30 near the demand zone and expects a short-term bounce toward $3.80 soon. Moreover, price action shows that the token consolidates for the last sessions and is ready to smash the range. However, the upper trajectory is near $4.00, and the lower trajectory is near $3.00; a sharp move can be seen beyond the sides.
Technical Levels
Support Levels: $3.00 and $2.80
Resistance Levels: $3.80 and $4.00
Disclaimer
The views and opinions stated by the author or any people named in this article are for informational purposes only, and they do not establish financial, investment, or other advice. Investing in or trading crypto or stock comes with a risk of financial loss.
 thecoinrepublic.com