The cryptocurrency market saw a fresh nosedive in recent weeks as the price of cryptocurrencies, including the likes of Bitcoin (BTC), Ethereum (ETH), and Dogecoin (DOGE), saw fresh new lows.
With so many uncertainties surrounding the crypto market, there are speculations about the price of Bitcoin (BTC), retesting a key demand zone that has proven to be an area of interest for traders and investors to open a long position.
The crypto market continues to face many uncertainties and fear despite these factors; there are the top 5 cryptocurrencies (DOGE, SHIB, SFP, OCEAN, FET) that have caught the attention of traders and investors ahead of a new week as these altcoins could produce huge gains.
The cryptocurrency heat map shows the market performance over the week as the price actions of Bitcoin, Ethereum, Binance Coin, and other top-ranking cryptocurrencies continue to show worrying price actions.
The price of Bitcoin (BTC) lost its key support of $28,500 on higher and lower times and has since continued to trend in bearish price action as bears continue to dominate the price of BTC, pushing its price down to a region of $26,000.
The price of BTC trading below its daily 50-day and 200-day Exponential Moving Average (EMA) indicates much cause to worry for its price as the price could retest the region of $24,000, acting as a buy zone and demand zone for many traders and investors.
Based on data from the Bitcoin fear and greed index, there are high chances of BTC bears pushing the prices to this low as the market continues to trade in fear.
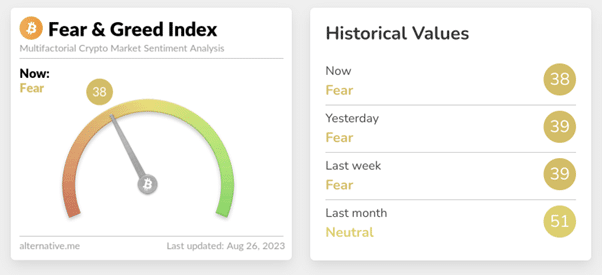
The Fear and Greed index for BTC has shown much fear in the cryptocurrency market for the past few weeks as the price could retest the region of $24,000, where there are demands to buy up BTC by bulls around this region.
Ethereum’s (ETH) price hasn’t been very encouraging either after losing its key support of $1,650; the price of ETH has struggled to show real conviction by bulls to rally its price higher as the price of ETH looks prime for a retest of $1,550.
A close for ETH price below $1,650 could see the price trade lower to a region of $1,550, where bulls would be willing to drive the price of ETH higher from its buy zone.
Although Bitcoin and Ethereum take much price dominance and focus, let us examine some of the top 5 cryptocurrencies (DOGE, SHIB, SFP, OCEAN, FET) that could outperform Bitcoin and Ethereum in the coming weeks with artificial intelligence (AI) hype beginning to pick up.
Top 5 Cryptocurrencies – Dogecoin (DOGE) Price Analysis on the Daily (1D) Timeframe
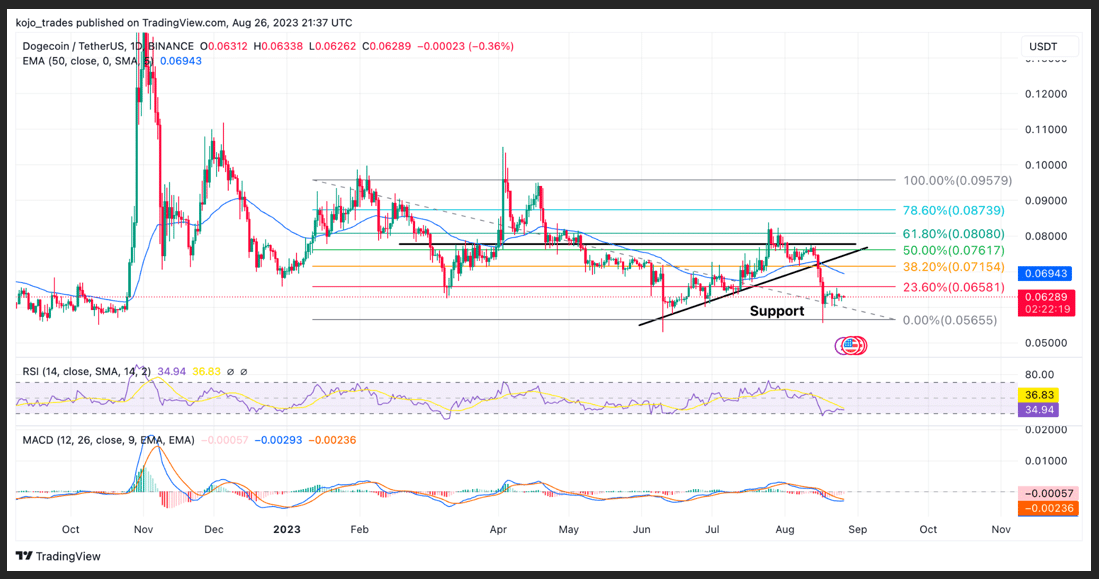
“X is a dog, and DOGE is a friendly” was Elon Musk’s quote on X (formerly Twitter) as a huge advocate of DOGE in recent years, but his tweet had little to no effect on the price as the price of DOGE suffered a fresh new setback in its price as price broke below its bullish uptrend.
The break in price for DOGE/USDT flipped its bullish uptrend into a bearish downtrend as the price of DOGE looks set to retest the low of $0.056, acting as the area of demand in precious price decline as the price of DOGE/USDT has always respected this region bouncing off to new highs.
DOGE’s price needs to hold above this region of $0.056, defended by bulls in the past; if the price of DOGE/USDT fails to hold off bears from pushing its price lower in this region, we could see new lows for DOGE price.
The price of DOGE/USDT trades below its 50-day EMA and its 23.6% Fibonacci Retracement value (FIB 23.6% value), indicating much dominance by bears as bulls need to step in and rescue the price of DOGE, else the bear pushes price lower.
The Moving Average Convergence Divergence (MACD) on the daily timeframe for DOGE indicates bears are much in control of prices as prices could continue to trend in a bearish downtrend if bulls fail to defend the region of $0.055.
The Relative Strength Index (RSI) for DOGE looks bearish as this lagging indicator trades below 40, which indicates more sell orders for bears.
Placing a buy order at $0.060 would be a high chance of making a good profit return as the market returns from its downtrend price movement.
Major DOGE/USDT support zone – $0.06
Major DOGE/USDT resistance zone – $0.071
MACD trend – Bearish
Shiba Inu (SHIB) Price Chart Analysis
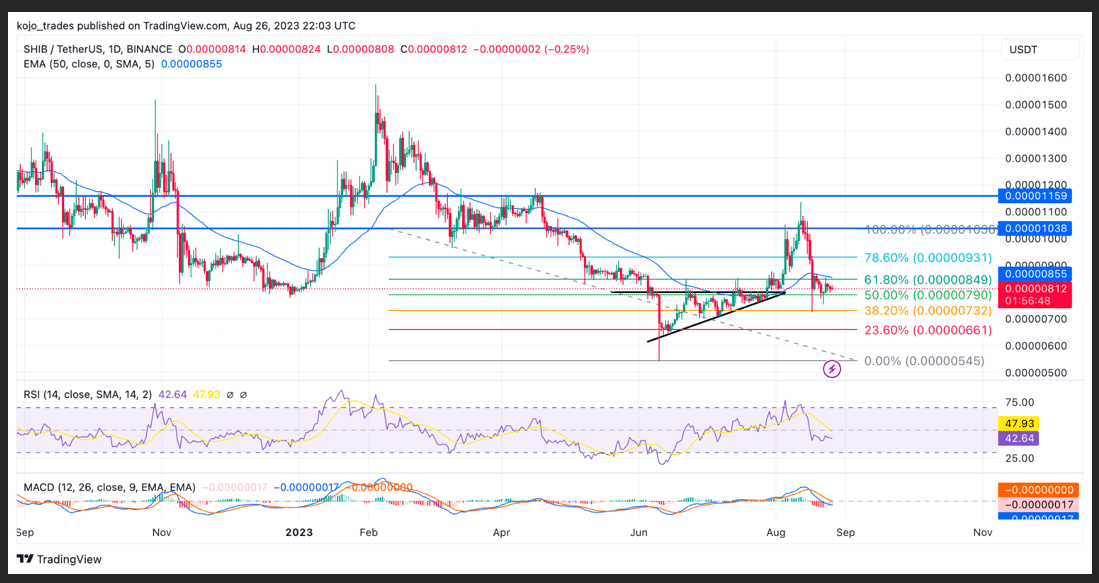
After a successful breakout from its bullish ascending triangle, the price of SHIB rallied from a region of $0.00000660 to a high of $0.00001100, where it suffered rejection by bears to trade higher to a high of $0.00001200.
The price of SHIB had a price movement of over 80% from its low of $0.00000660 as the price failed to break above the key resistance of $0.00001200, where the price of SHIB could have traded higher.
SHIB’s price currently trades above $0.00000750, acting as support for the price of SHIB, which corresponds with the 38.2% FIB value where the price of SHIB has recently bounced off, indicating a high potential of buy orders getting filled.
As far as the price of SHIB trades above $0.00000750 and 38.2% FIB value, the bulls can push prices higher as the market bounces to its bullish sentiment. If the price of SHIB fails to hold above $0.00000750, we could see the price trade around its low of $0.00000660.
The MACD and RSI for SHIB indicate a change in trend from bullish to bearish, and bears could have full control if the price of SHIB fails to hold above $0.00000750, acting as an area of interest for bulls and bears.
The price of SHIB needs to reclaim its price above the 50-day EMA, which corresponds to $0.00000850, to enable bulls to push the price higher to reclaim $0.00001200, acting as strong resistance.
Major SHIB/USDT support zone – $0.00000750
Major SHIB/USDT resistance zone – $0.00000850
MACD trend – Bearish
SafePal (SFP) Price Analysis as a Top Crypto to Watch
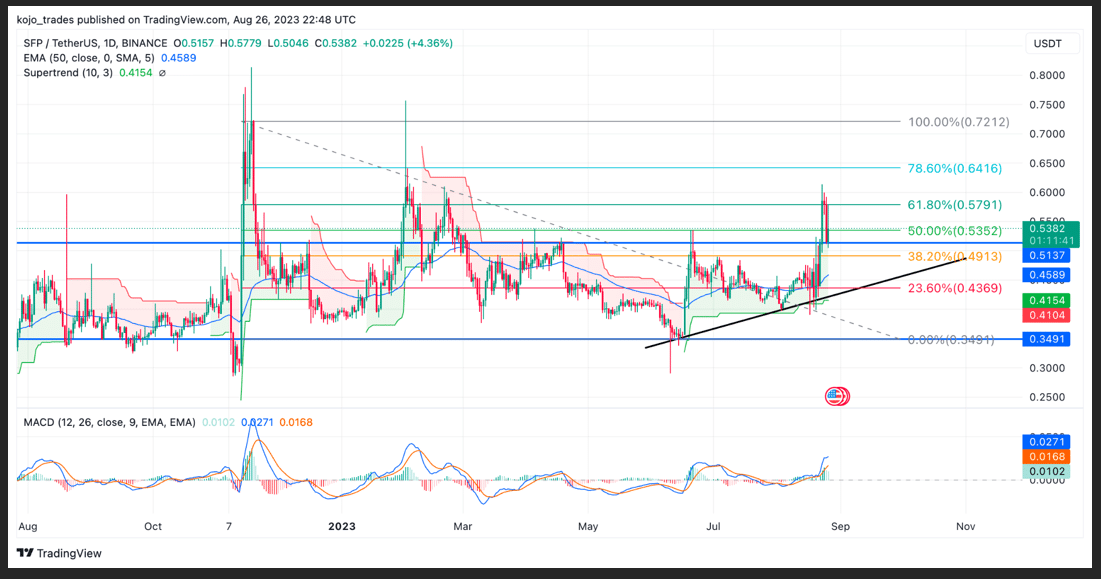
SafePal (SFP) has remained one of the top 5 cryptocurrencies that have remained bullish on all timeframes despite the uncertainties of the cryptocurrency market, as both the super trend and MACD indicators point to bullish price actions.
The price of SFP/USDT formed a strong support at $0.35 as the price bounced from this region to a high of $0.4, where the price of SFP broke out and flipped its strong resistance of $0.4 into support as bulls pushed SFP to $0.6.
SFP faced price rejection to a region of $0.53 as the price continues to hold above the FIB value of 38.2%, which corresponds to $0.5, just above the 50-day EMA acting as a minor support zone for the price of SFP.
If bulls hold the price of SFP above $0.5, there are high chances of SFP retesting the high of $0.73 as its price action points to one direction of bulls.
The MACD and supertrend for SFP continue to be bullish as the price heads into a new week.
Major SFP/USDT support zone – $0.5
Major SFP/USDT resistance zone – $0.72
MACD trend – Bullish
Ocean Protocol (OCEAN) Price Analysis Chart
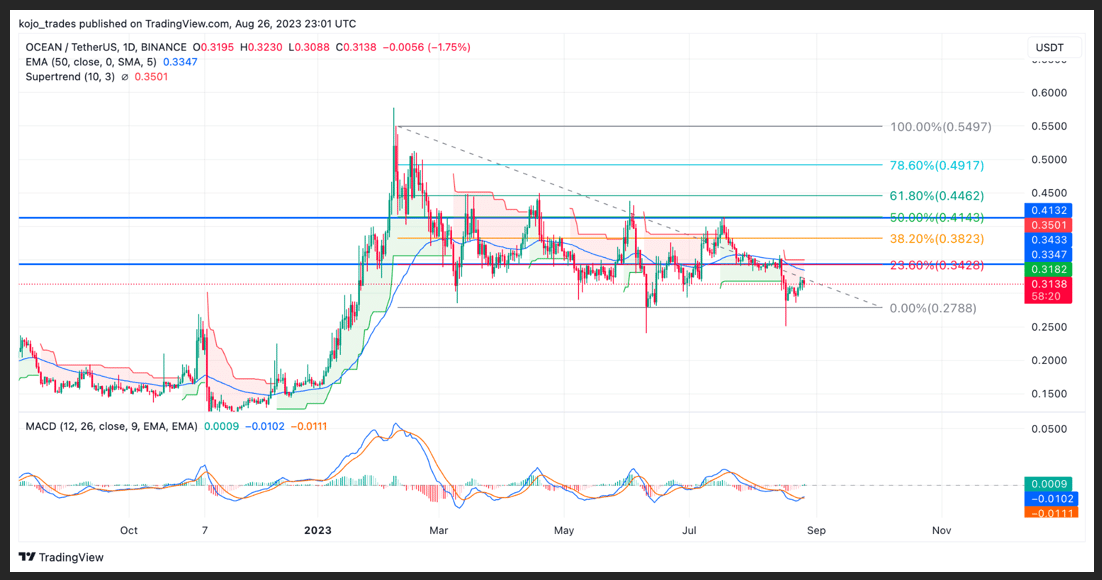
Ocean Protocol (OCEAN) has remained a huge project to pay attention to, and it is no surprise it resurfaces as one of the top 5 cryptocurrencies to watch for the week, considering how artificial intelligence hype has influenced its price rally.
The hype around AI tokens is one to pay attention to as this has seen the price of OCEAN rally from $0.12 to a high of $0.55 with over 500% gain despite the bear market that has affected many crypto tokens.
OCEAN’s price suffered a rejection by bears as the price dropped to a low of $0.28, where it has formed strong support to hold off sell orders. The price rose to $0.32 as the price aims to restart its bullish run.
The price of OCEAN currently trades below its 50-day EMA and its 23.6% FIB value. The price of OCEAN needs to break and close above its 50-day EMA and its 23.6% FIB value for the price to rally to a high of $0.38 and higher.
If the price of OCEAN fails to reclaim these regions, we could see the price of OCEAN remain bearish as its MACD indicator continues to trade in a bearish trend.
Major OCEAN/USDT support zone – $0.28
Major OCEAN/USDT resistance zone – $0.40
MACD trend – Bearish
Fetch.AI (FET) Price Analysis on the Daily Timeframe
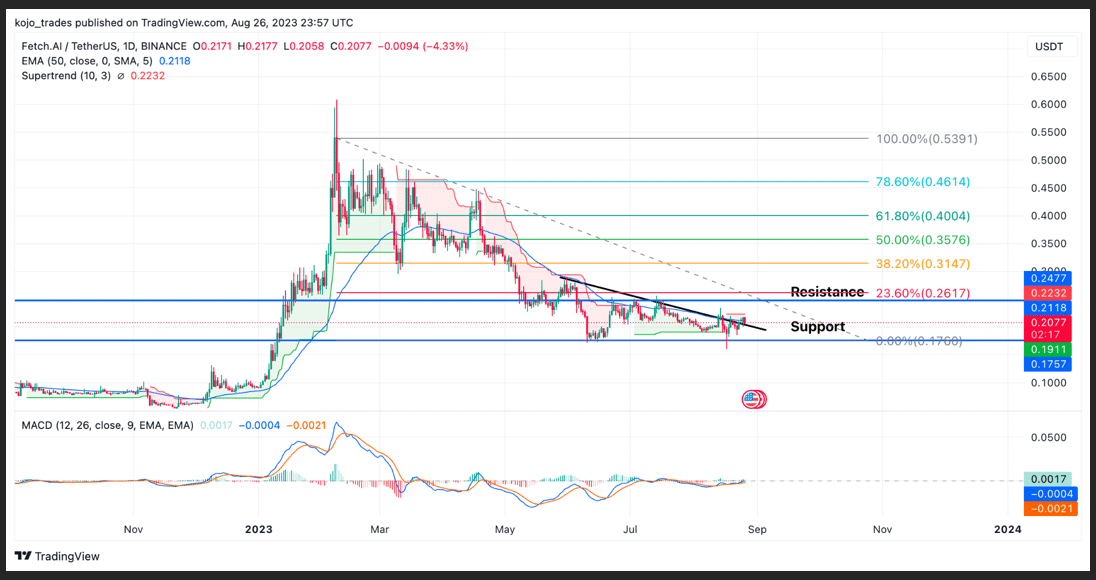
Fetch.ai (FET) remains a top 5 crypto altcoin spoken about after the price rallied by over 500% in the past few months, with the hype of AI tokens intensely hitting up the crypto market.
The price of FET/USDT rallied from its yearly low of $0.077 to a high of $0.53, hitting over 500% in a few months for bulls as the AI narrative continues to look promising ahead of the coming crypto rally.
FET’s price was rejected from its high of $0.53 as it dropped to a low of $0.2, forming a good support and demand zone for buy orders.
The price of FET currently trades above the 50-day EMA and below the 23.6% FIB value as bears continue to dominate its price.
The price of FET needs to break and close above the high of 23.6% to resume a minor price recovery to a high of $0.25, where the price could face strong resistance.
The supertrend and MACD for FET continue to look promising as the price looks ready to change from a bearish to a bullish trend ahead of a new week.
Major FET/USDT support zone – $0.2
Major FET/USDT resistance zone – $0.25
MACD trend – Bullish
 thecryptobasic.com