- Render (RNDR) price bounced 10% after AI hype around Nvidia triggered upside for AI stocks and crypto tokens.
- Render bulls are targeting the key price level of $1.58, which could allow for a short-term breakout to $2.00.
Render (RNDR) price rose sharply on Thursday as the altcoin reacted higher on Nvidia earnings that crushed expectations. With hype around AI hitting a new high after another huge guidance from Nvidia, RNDR price looks poised for a retest of the key supply zone near $1.58.
RNDR price up as AI narrative strengthens
On Wednesday, the semiconductor giant took the market by storm with its revenue and guidance. As announced, the chip maker’s net income of $6.7 billion for the quarter ending July 30 was 422% up on the same period a year ago. Projections for the coming quarters saw investors rush to position themselves, with AI stocks bouncing higher.
With Nvidia’s AI bet providing a sector-wide boost, it was no surprise to see crypto AI tokens also surge. According to data from CoinGecko, the total market cap of the sub-sector was up 3.6% to over $2.48 billion. Render, SingularityNET and Fetch.ai lead the top gainers with over 8% upside for each.
Render, whose AI-powered blockchain technology targets the largely untapped graphics processing unit (GPU) rendering market, could ride the Nvidia AI hype to greater adoption.
Demand for the Render technology cuts across gaming, metaverse, AI, NFTs, and VR narratives. These sectors are heavily tapping into GPU rendering. Some of the companies and crypto platforms working with the project include Cinema 4D, Nvidia, Solana, Mattel, and Metaplex.
Render price: short-term forecast
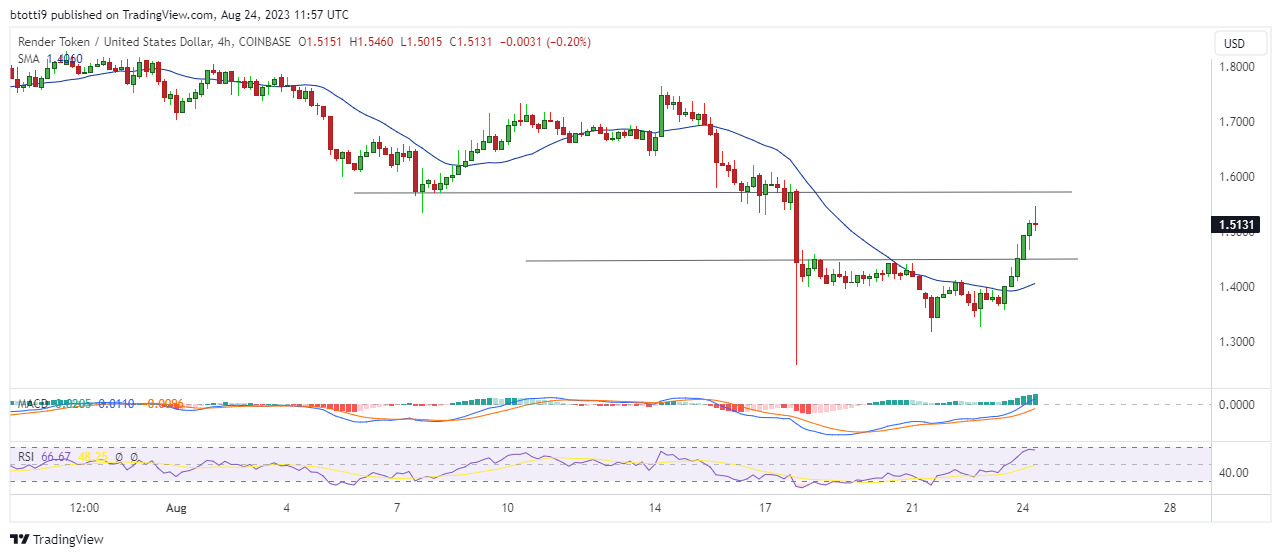
The price of Render’s native token jumped more than 10% in intraday trading to hit highs of $1.54. The upside saw the cryptocurrency come close to a weekly ceiling around $1.58 – likely the area to trigger further demand to $2.00
RNDR’s market cap was up 11% to over $564 million while 24-hour trading volume spiked 168% to over $44.6 million.
A look at the RNDR/USD price on the 4-hour chart shows bulls have work to do if they are to push higher. The price is below the key technical area of $1.58, the range from which prices plummeted more than 8% on August 17.
 Render 4-hour price chart. Source: TradingView
Although short-term momentum looks to favour buyers as suggested by the 4-hour MACD and RSI, the price needs to break above the highlighted hurdle to strengthen the bullish outlook.
If price flips lower, immediate support is around $1.45 and then $1.40 (where the 20-day simple moving average is slightly upturned).