Markets have started on a recovery run, with the global market cap recording a 1.65% increase in a day to take the total cap to $1.07T as of press time. The fear and greed index is also at 35, as fear creeps out of the market.
Bitcoin (BTC) analysis
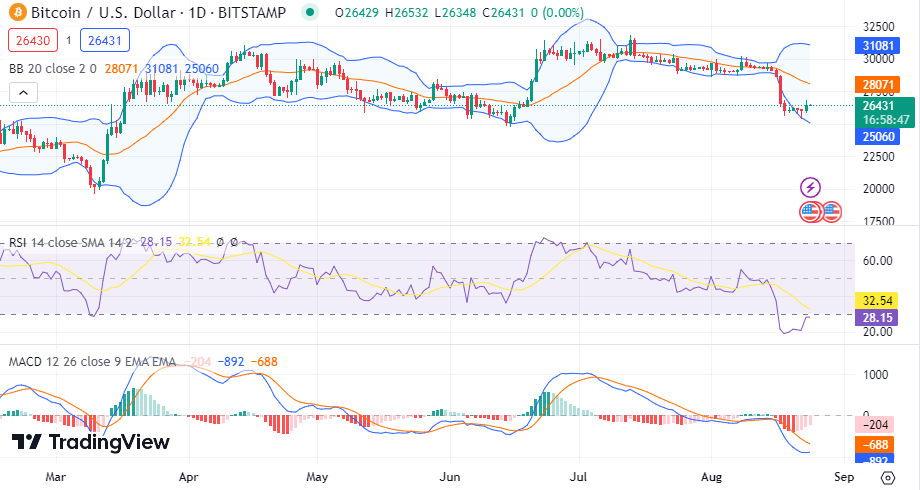
Bitcoin (BTC) has encountered bull activity, trading at $26.4K after recording a daily increase of 1.42%, as the weekly decrease now stands at 7.6%. Bitcoin’s trade volume has risen by 6% during the same period and is presently at $16.4B.
The Bollinger bands are still diverging, indicating that the volatility of Bitcoin is still high. The Relative Strength Index (RSI) is still below its average line in the oversold region, as bulls now push for recovery out of the zone while the MACD also moves towards a shift to the green zone.
Ethereum (ETH) analysis
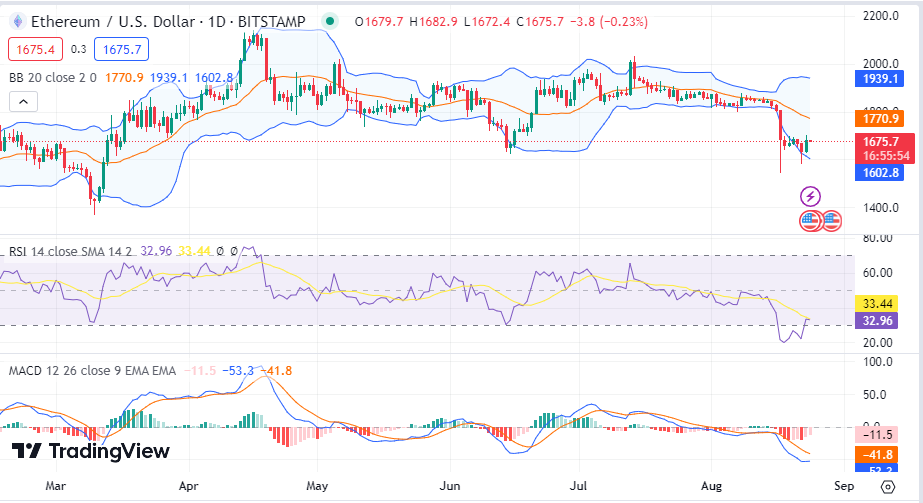
Ethereum (ETH) has also started today on bull activity, as the asset now sits on gains of 1.9% within a day of trading to take it to $1675 as the trading volume dropped by 18% to take it to $6.5B as of press time. ETH’s volatility levels are also increasing as the Bollinger bands diverge.
The RSI indicator is still below the average line as bulls now push for a recovery from the dip. The MACD indicator also moves in the red zone as it approaches a shift to the green zone.
Shiba Inu (SHIB) analysis
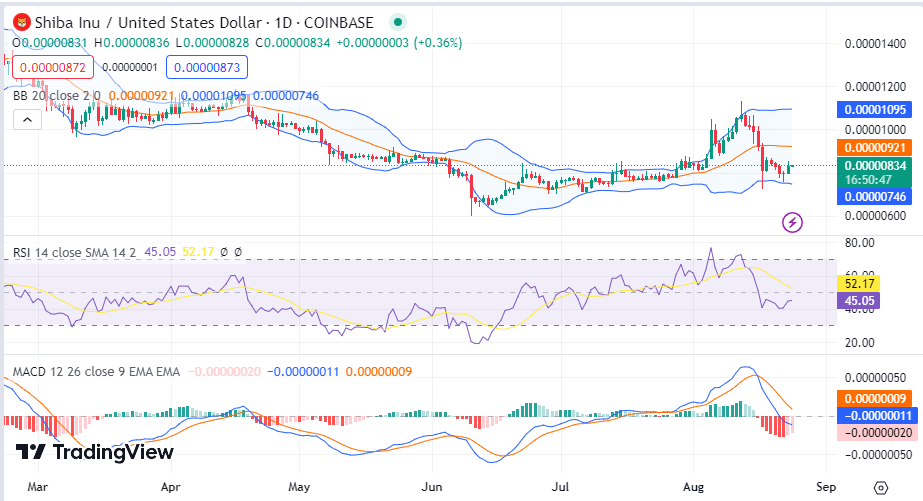
SHIB is also having a good session as the asset trades 1.9% above its previous 24-hour price to an old spot price of $0.000008346 as the trading volume dropped by 2.7% as of press time to now stand at $186M. SHIB’s volatility levels are now high as the Bollinger bands maintain a far distance away from each other.
The RSI is still below its average line as bulls now push for a recovery while the MACD also still moves in the red zone, showing the great bear effect left after the recent dip.
EOS (EOS) analysis
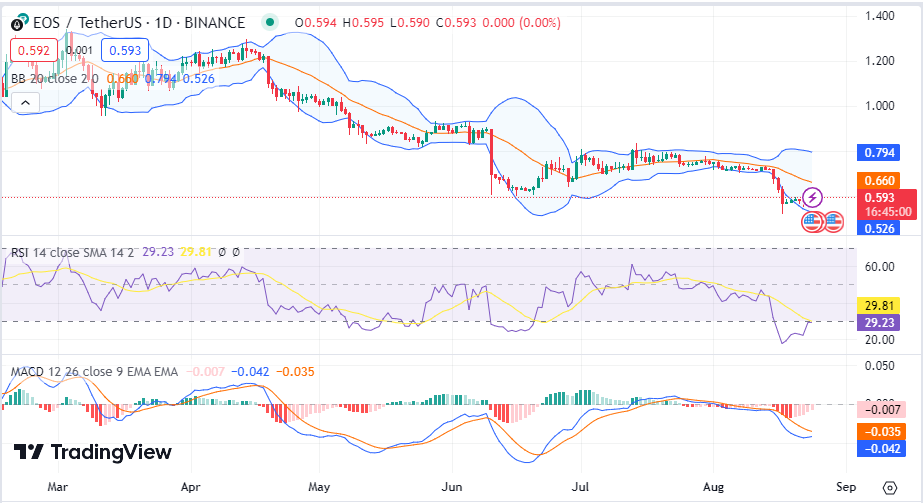
EOS is also having a tremendous session today as the asset trades 1.69% above its previous 24-hour price, with the asset holding a spot price of $0.5927 as the trading volume saw a 15% decrease within the same period to now stand at $87.8M.
EOS’s volatility levels are now increasing as the Bollinger bands diverge from each other, showing signs of increasing volatility levels as the RSI approaches a shift above the average line, showing bull efforts on the token. The MACD indicator is also now approaching a shift to the green zone.
SafePal (SFP) analysis
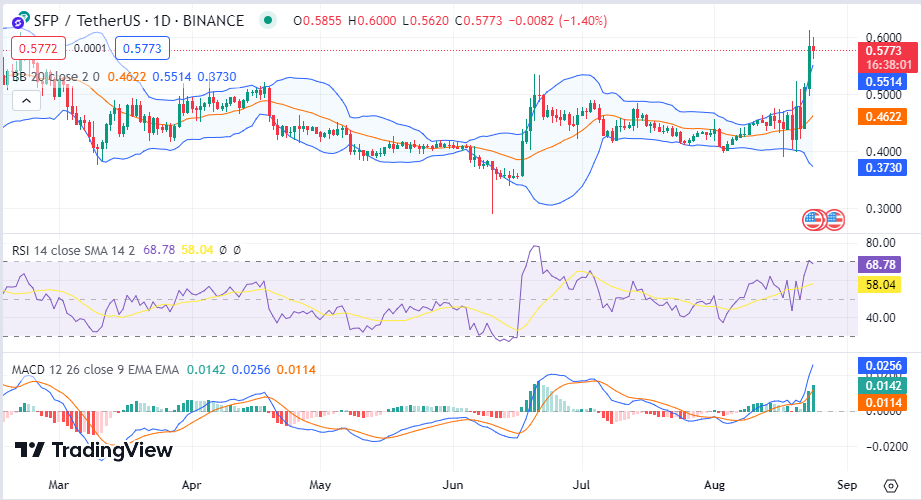
SFP is also having a tremendous session, and the asset trades 11% above its previous 24-hour price to now hold a spot price of $0.58, as the trading volume also saw a 9% decrease within the same period.
SFP’s volatility levels are also rising as the Bollinger bands diverge from each other while the RSI moves above its average line, with the MACd also in the green zone showing total bull dominance on SFP.
