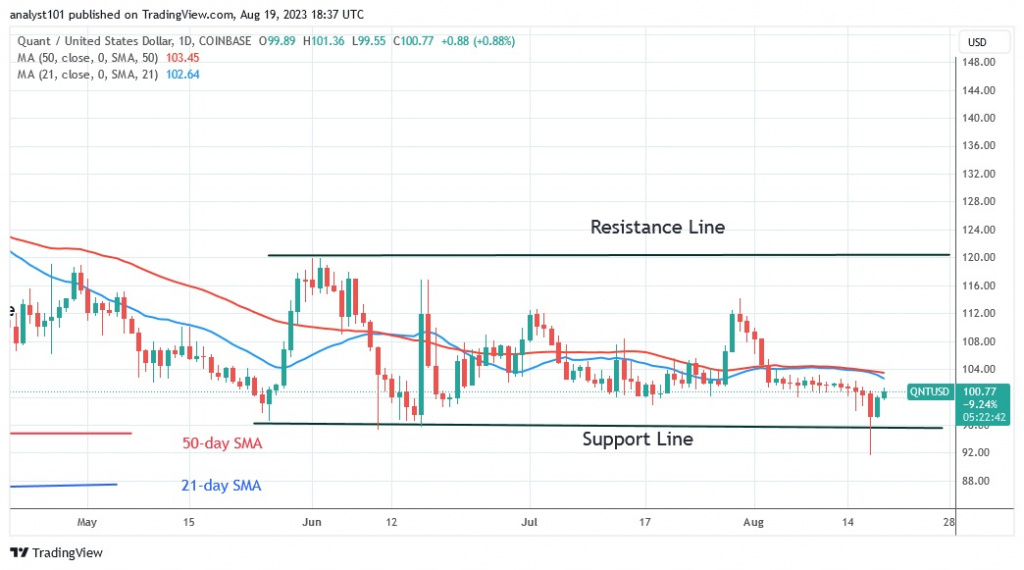
Cryptocurrency analysts of Coinidol.com report, Quant (QNT) price has declined and retested the lower price range of $95.
Quant long term price forecast: in range
The cryptocurrency price has returned to the range-bound zone. The altcoin returns to the price range of $95 to $120. The moving average lines are expected to hinder the upward movement.
However, if QNT breaks above the moving average lines, it will reach a high of $110. The uptrend will continue to the high of $120. In the meantime, QNT/USD will be forced to trade range bound above the current support if the bullish scenario becomes invalid.
Quant price indicator analysis
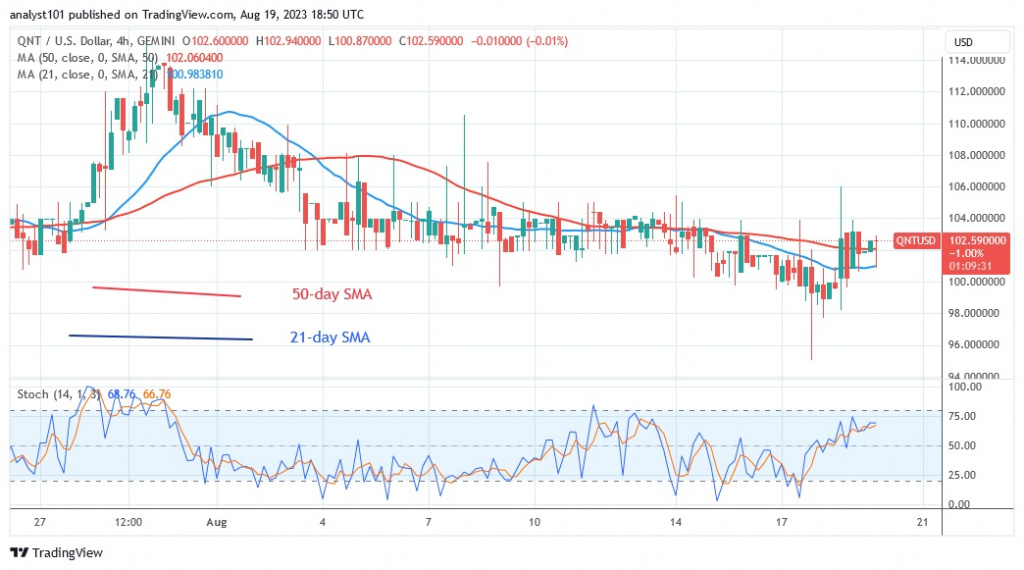
At the 44 level of the Relative Strength Index, altcoin is in a negative trend. Despite the uptrend, the price bars are below the moving average lines. The moving average lines are sloping horizontally, which indicates a sideways trend. The altcoin is rising above the 50 level of the daily stochastic. The bullish momentum has stalled near the moving average lines.

Technical Indicators
Key supply zones: $140, $150, $160
Key demand zones: $90, $80, $70
What is the next step for Quant?
QNT/USD has returned to the trading range after the recent slump. At the moving average lines, the price is rising. If the cryptocurrency does not cross the moving average lines, the movement to the range will start. QNT will trade just below the moving average lines.

Last week Coinidol.com reported that the price of Quant (QNT) has been steadily rising above the $100 level since August 4. The price movement was slowed down by small indecisive candles known as doji.
Disclaimer. This analysis and forecast are the personal opinions of the author and are not a recommendation to buy or sell cryptocurrency and should not be viewed as an endorsement by CoinIdol.com. Readers should do their research before investing in funds.
 coinidol.com
