
During a significant cryptocurrency market drop on August 17, Internet Computer ($ICP), $SUI, and Apecoin ($APE) all fell to new all-time lows.
While $ICP has not yet closed below its main horizontal support level, $SUI and $APE crashed through theirs without a bounce.
Internet Computer ($ICP) Price Closes Below $3.50
The $ICP price has fallen under a descending resistance line since reaching a yearly high of $8.23 on February 18. The decrease led to a low of $3.35 on June 10, and the price bounced at the $3.50 horizontal support area (green icon).
However, $ICP failed to sustain its increase. Rather, it was rejected by the resistance line again on August 14 and fell to a new all-time low price of $3.15 three days later.
Despite the decrease, the $ICP price has not yet closed below the $3.50 horizontal support area. As long as it does not do that, the potential for a bullish trend reversal still remains.
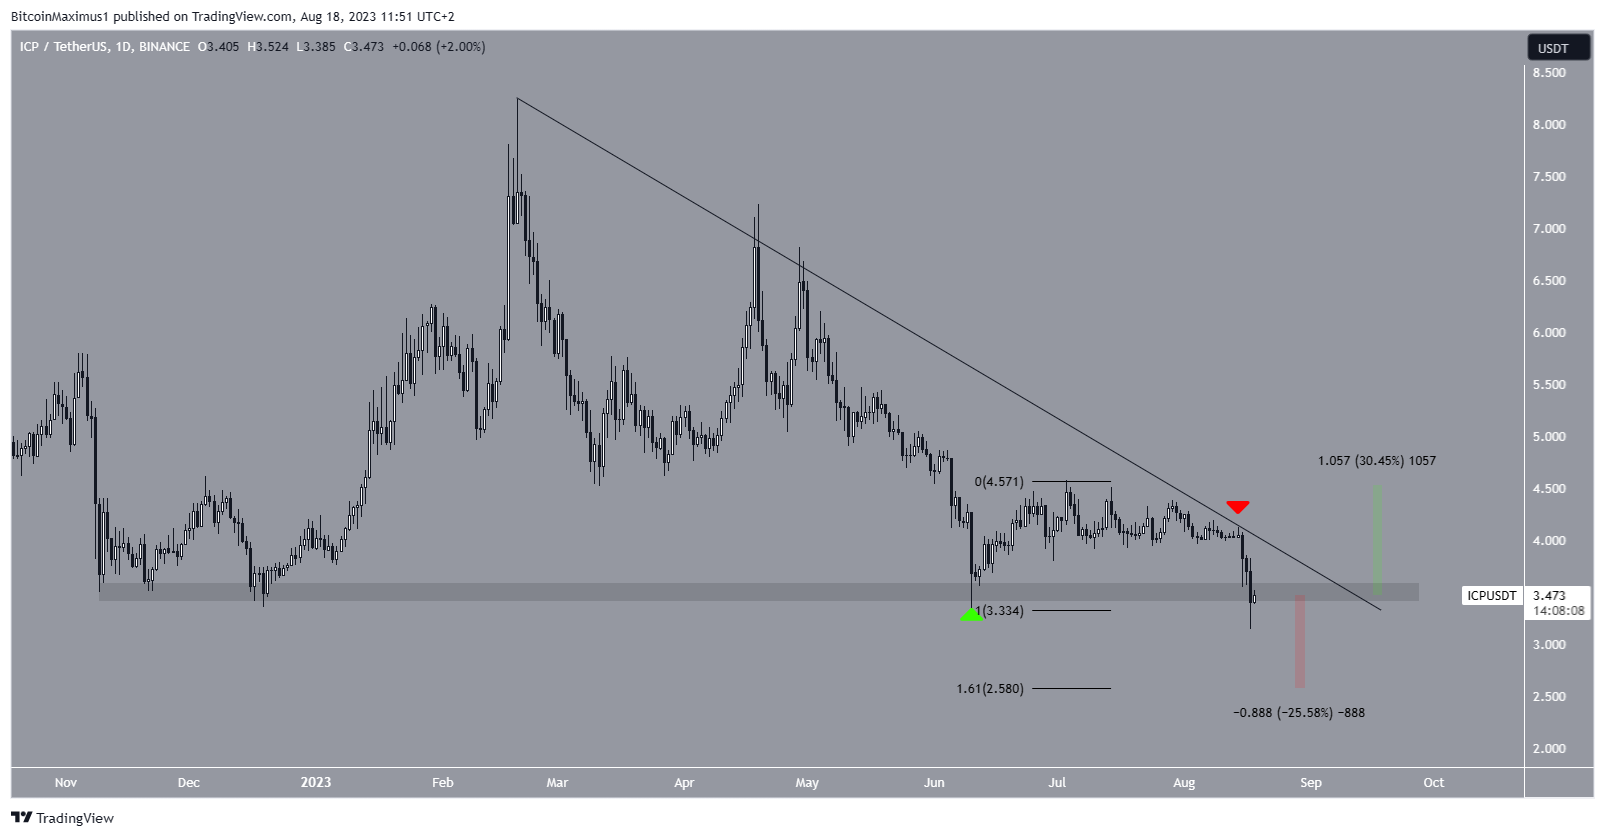
If the decrease continues, the $ICP price can fall by another 25% and reach the next support at $2.58. Since the price is at an all-time low, the 1.61 external Fib retracement is required to find the next closest support.
On the other hand, in case of a breakout, the price can increase by 30% and reach the next resistance at $4.50.
$SUI Price Crashes Below Support
The $SUI price has fallen under a descending resistance line since June 22. The line has caused numerous rejections, most recently on August 13. This catalyzed the ongoing decrease and led to a new all-time low of $0.45.
The next closest support is at $0.41, a drop of 15% measuring from the current price.
Interested in AI Trading? 9 Best AI Crypto Trading Bots to Maximize Your Profits
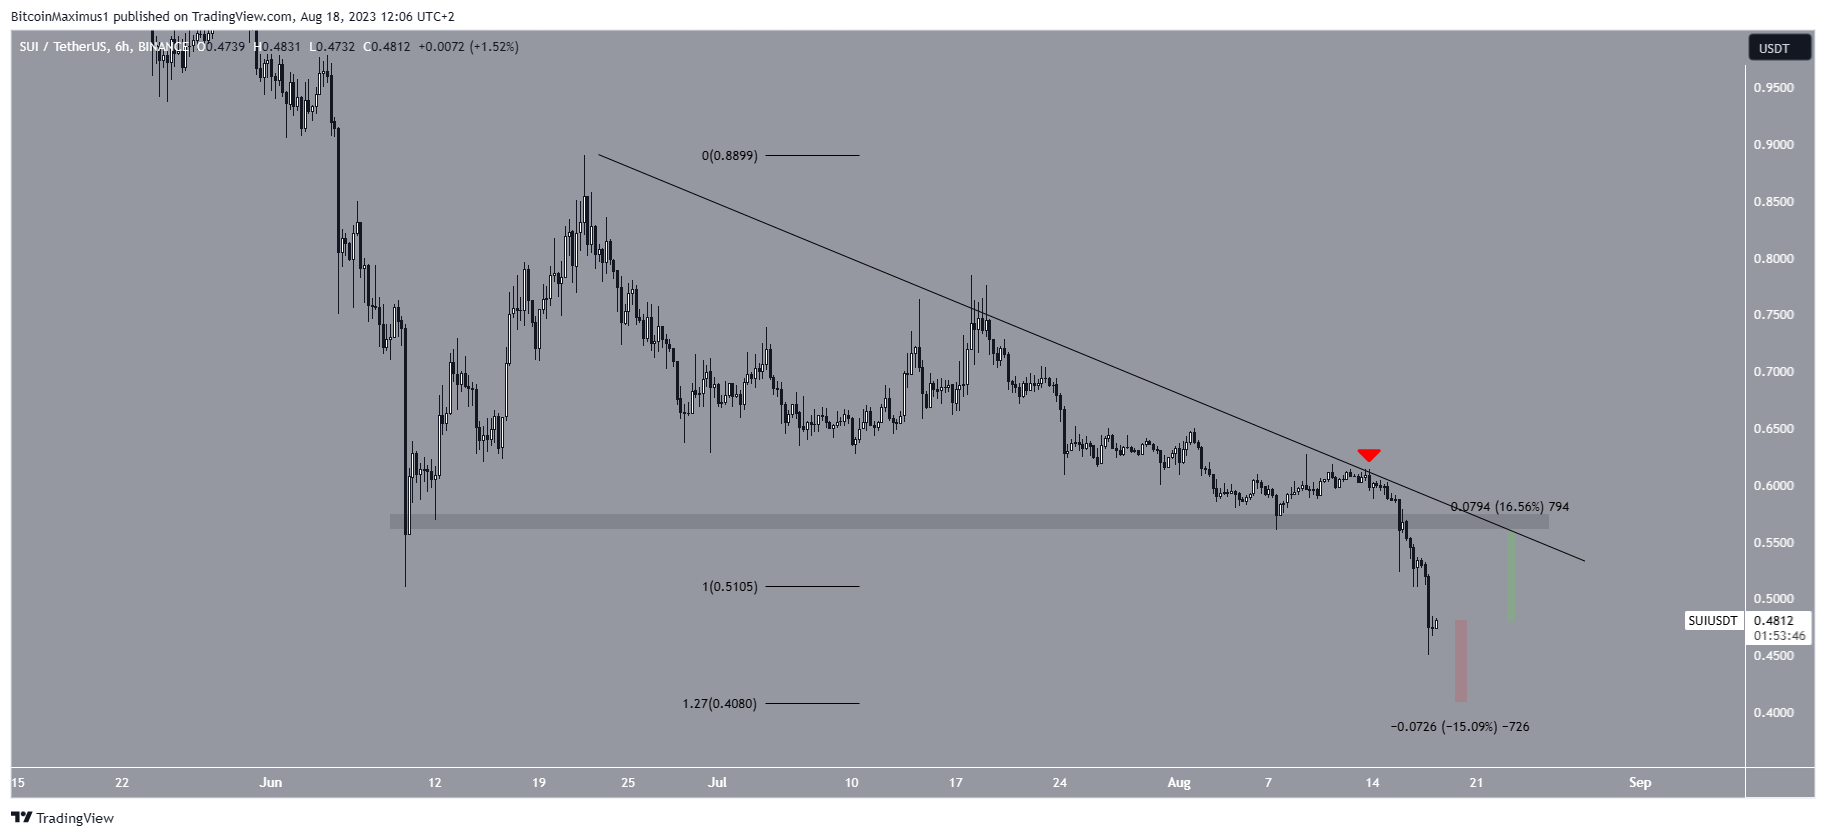
On the other hand, if the $SUI price bounces, it can reach the descending resistance line at $0.55, an increase of 17% measuring from the current price.
Can Apecoin ($APE) Price Bounce at Support?
The $APE price has fallen inside a descending parallel channel since June 17. These channels are considered corrective patterns. Therefore, an eventual breakout from it would be the most likely scenario.
However, the $APE price broke down from the $1.80 horizontal support area on August 17 and reached a new all-time low of $1.34. This is a bearish sign and puts the possibility of a breakout from the channel at risk.
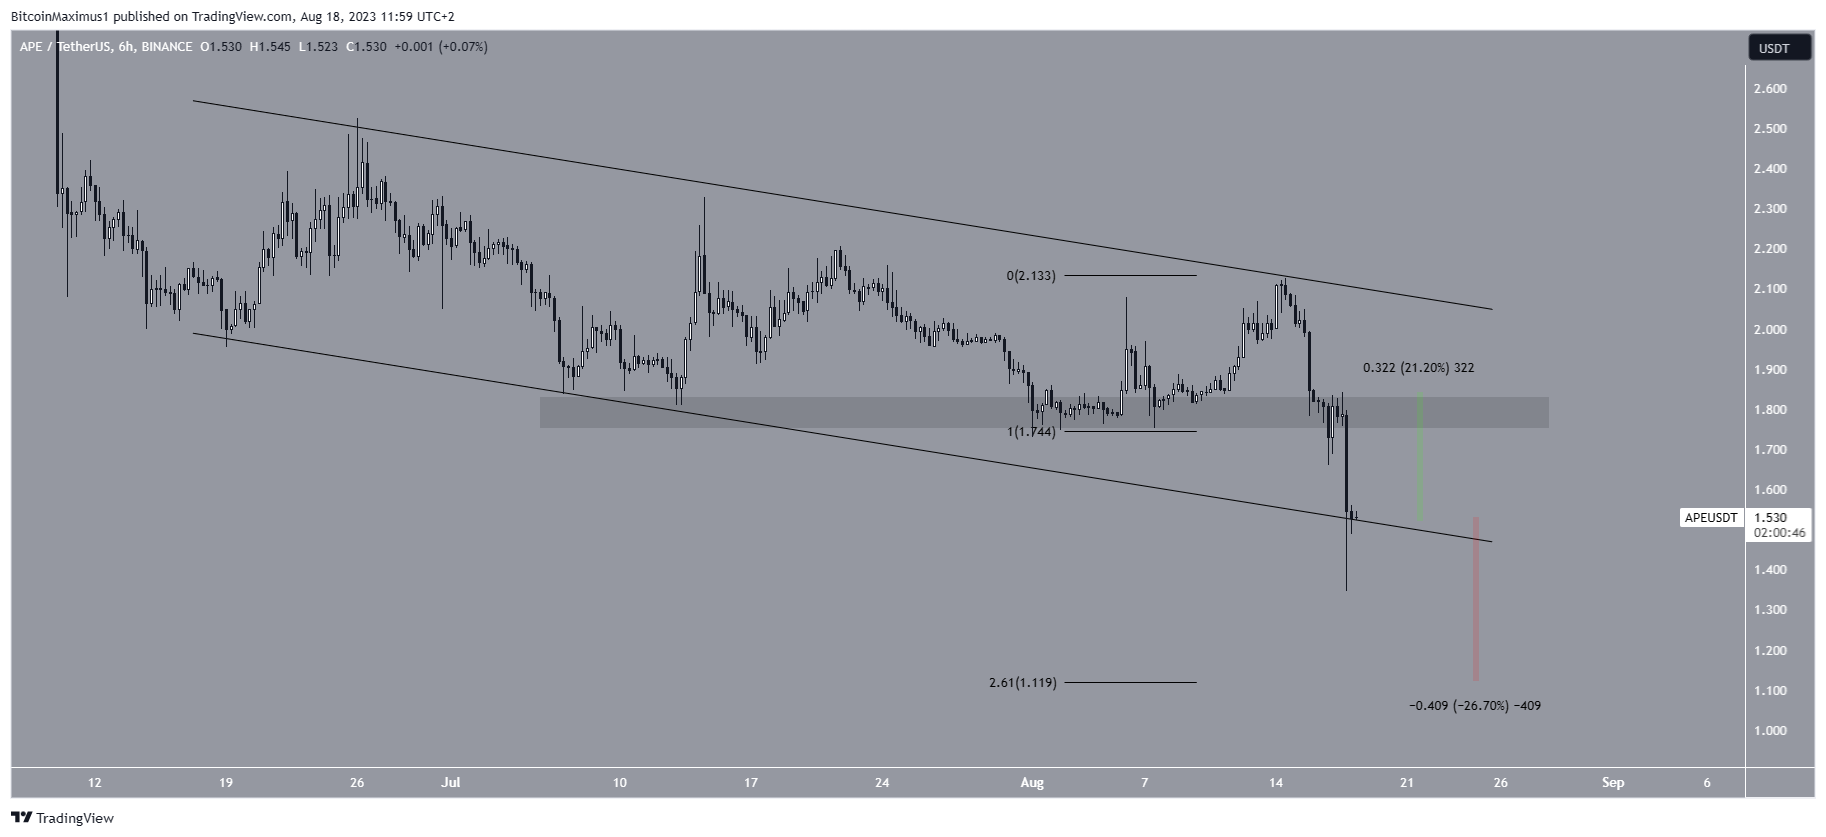
A strong bounce at the channel’s support line can lead to a 20% increase to $1.80. On the other hand, a breakdown from the channel would take the price to $1.11, a drop of 26% measuring from the current price.