Markets have strong bear activity, with the global market cap recording a 6.3% decrease in a day to take the total cap to $1.06T as of press time. The fear and greed index has also dropped to 37, as fear now creeps over the markets.
Bitcoin analysis
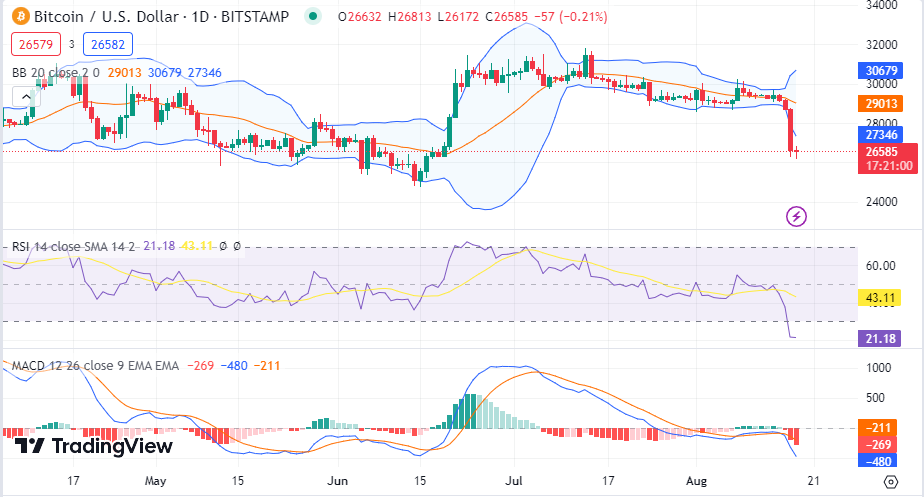
Bitcoin (BTC) is now facing massive bear activity as the asset drops back to the $26K level as it is now trading at $26.5K after recording a daily drop of 7.3% and a weekly decrease of 9.7%. Bitcoin’s trade volume has spiked by 103% during the same period and is presently at $33.4B.
The Bollinger bands are now diverging, indicating a rise in the volatility of Bitcoin as the Relative Strength Index (RSI) is below its average level in the oversold region, indicating total bear dominance in today’s session as the MACD also now moves in the red zone.
Ethereum (ETH) analysis
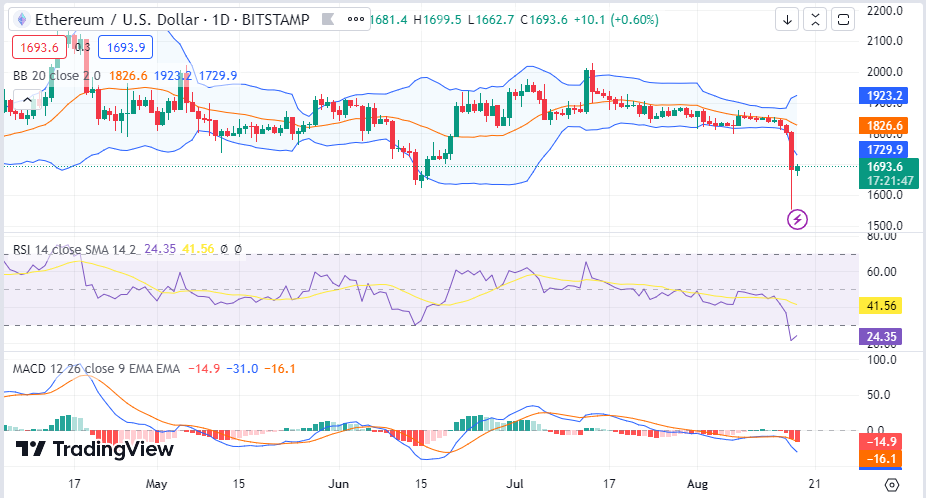
Ethereum (ETH) has also started slow, as the asset now sits on losses of 5.8% within a day of trading to take it to $1692 as the trading volume jumped by 188% to take it to $15.9B as of press time. ETH’s volatility levels are also now unstable as the Bollinger bands diverge from each other.
The RSI indicator is moving below its average line in the oversold region, indicating a bear dominance. The MACD indicator also moves below in the negative region, showing the effort by bears to dominate markets.
OG Fan Token (OG) analysis
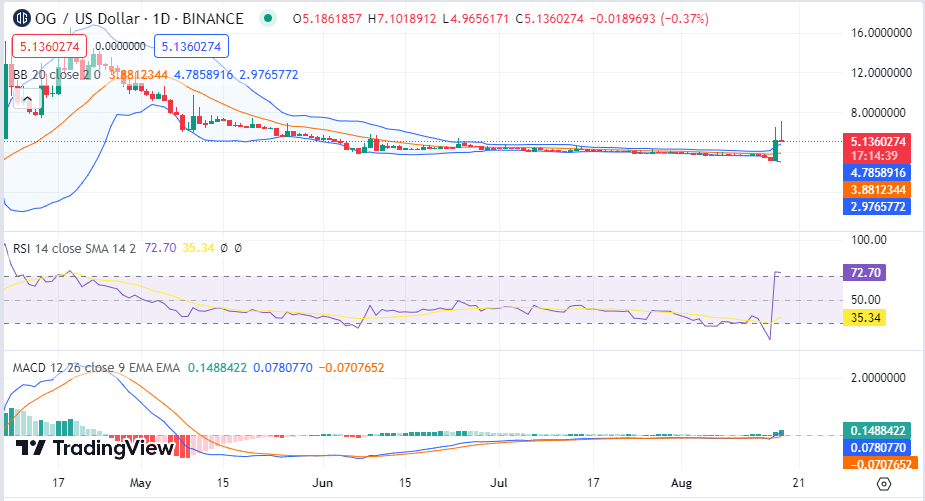
Despite the general bear trend in the market, OG seems to be defying the odds as the asset posts gains of 15% within a day’s trade to take its price to $5.15 as the trading volume spiked by 985% as it now stands at $284M.
OG’s volatility levels are also slightly rising as the asset’s Bollinger bands diverge from each other, with the RSI moving high in the overbought region displaying great bull dominance on OG. The MACD is also in the green zone as bulls dominate.
Osmosis (OSMO) analysis
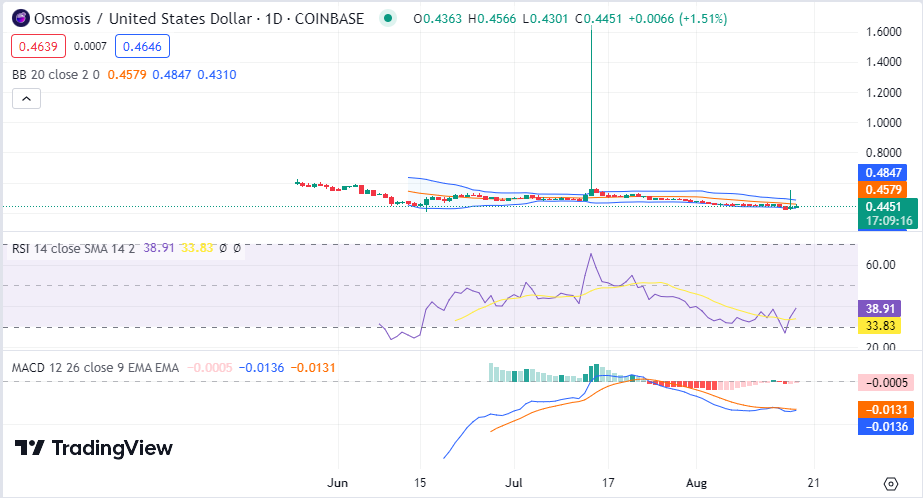
OSMO is having a tremendous session as the asset now sits on gains of 4% in today’s bear market to now trade at $0.4465 as the trading volume spiked by 774% within the same period to take it to $65M.
OSMO’s volatility levels are rather stable as the Bollinger bands maintain a rather close distance from each other. At the same time, the RSI moves above its average line, with the MACD also close to shifting to the green zone, showing great bull dominance on OSMO.
Other analysis
Other trending tokens are Shibarium Token (SHIBARIUM( which has failed to post gains in today’s session as the asset now trades 31% below its previous 24-hour price as the price now stands at $0.02028 with Cardano (ADA) also losing 4.3% in valuation to now trade at $0.2647. However, axe (AXE) is posting gains trading at $0.001858, representing an 8% 24-hour increase in valuation.
