- 1 ATOM price (ATOM) is up by 0.10% in the last 24 hours and is currently trading at $8.41.
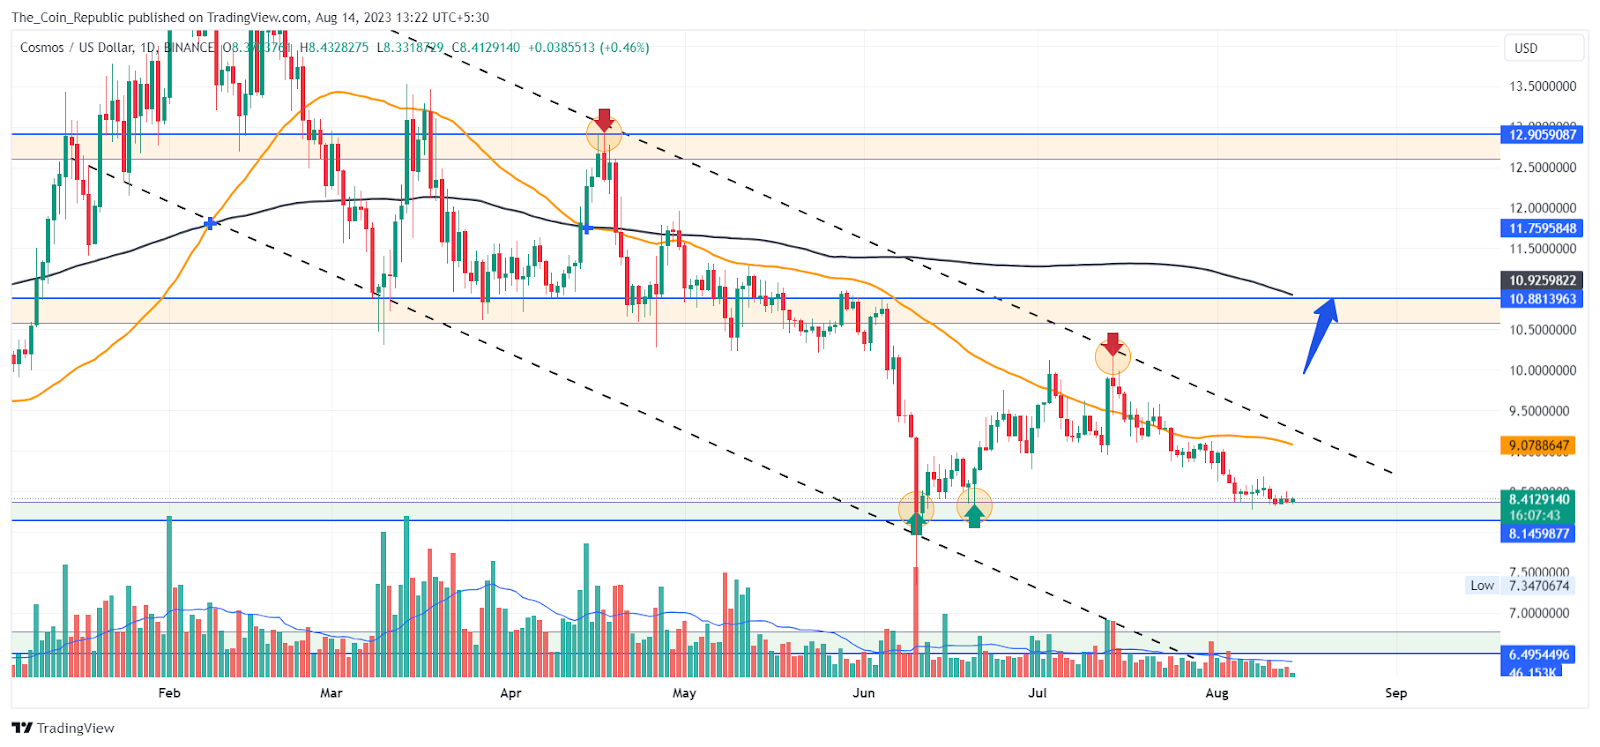
- 2 Cosmos price (ATOM) is trading in a parallel channel pattern and nearing a demand zone from where the price may experience buying pressure.
Atom price analysis reveals that the price has been in a declining trend for the past 6 months losing 37.20% of its value and has slid nearly 29.37% over the past 3 months.
The daily chart reveals that the price is forming a parallel channel pattern popularly known as a bullish flag pattern. The price is currently trading near the previous demand zone from where it may get the buyer’s volume to surge higher breaking above the channel pattern.
Cosmos is a project that aims to create a network of interoperable blockchains that can overcome the limitations of proof-of-work protocols, such as Bitcoin. It claims to offer faster, cheaper, scalable, and eco-friendly solutions for the blockchain industry. It uses a different consensus mechanism, called proof-of-stake, and a modular architecture, called Tendermint, to achieve its goals.
The ATOM token has a trading volume of $68.92 Million with a surge of 14.01% over the past 24 hours. It has over 346.6 Million tokens in circulating supply. The volume-to-market cap ratio of the Cosmos token is 2.37% indicating low volatility in the market at the current moment.
ATOM Price Prediction Signals that The Token Price Might Be Bottoming out

The ATOM price currently trades at $8.41 with a surge of 8.41% over the past 24 hours.
Recently, the price tried a recovery after a decline of 25% from the upper trendline but lacked momentum and suffered rejection, and slid again to the previous demand zone.
The short-term outlook of the price analysis states the price to consolidate near the demand zone followed by a breakout of the trendline resistance. However, it requires more buying volume to accumulate at the lower levels and surge the prices higher.
The long-term outlook for the price trend stands on the neutral to bearish side until the price remains in the channel. However, the price may shift its long-term trend to an uptrend if manages to break above the channel pattern.
Cosmos Price Looking Weak As Viewed By Technical Indicators

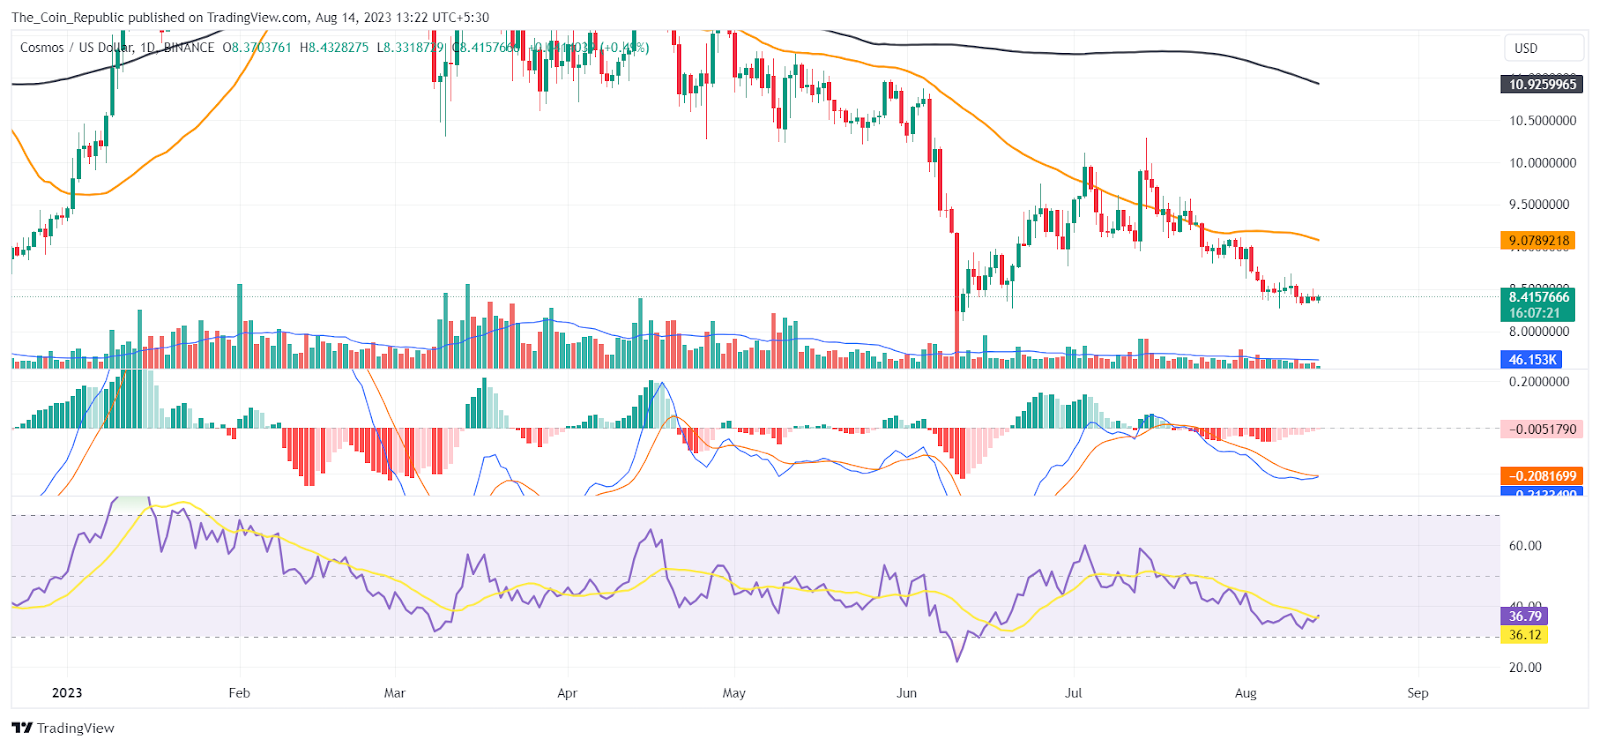
As per the EMA analysis, the Cosmos price is trading below both the 50 and 200 EMA which indicates the prevalation and continuation of the declining trend. The EMAs may act as a resistance to the rising price.
At the time of publishing, the RSI value of the Cosmos token is 37.81 and that of the SMA line is 36.20. RSI is showing a bullish divergence indicating the price might show some bullishness in the upcoming sessions.
Conclusion
ATOM price prediction concludes that the price has been declining for six months and is now trading in a bullish flag pattern. The price is near a demand zone that may trigger a breakout above the channel. However, the price needs more buyers to push it higher. The short-term outlook is consolidation followed by a breakout. The long-term outlook is neutral to bearish until the price exits the channel. The price may turn bullish if it breaks above the channel.
Technical Levels
- Support levels: $8.14 and $6.49.
- Resistance levels: $10.88 and $12.90.
Disclaimer
The views and opinions stated by the author, or any people named in this article, are for informational purposes only and do not establish financial, investment, or other advice. Investing in or trading crypto or stock comes with a risk of financial loss.
 thecoinrepublic.com
