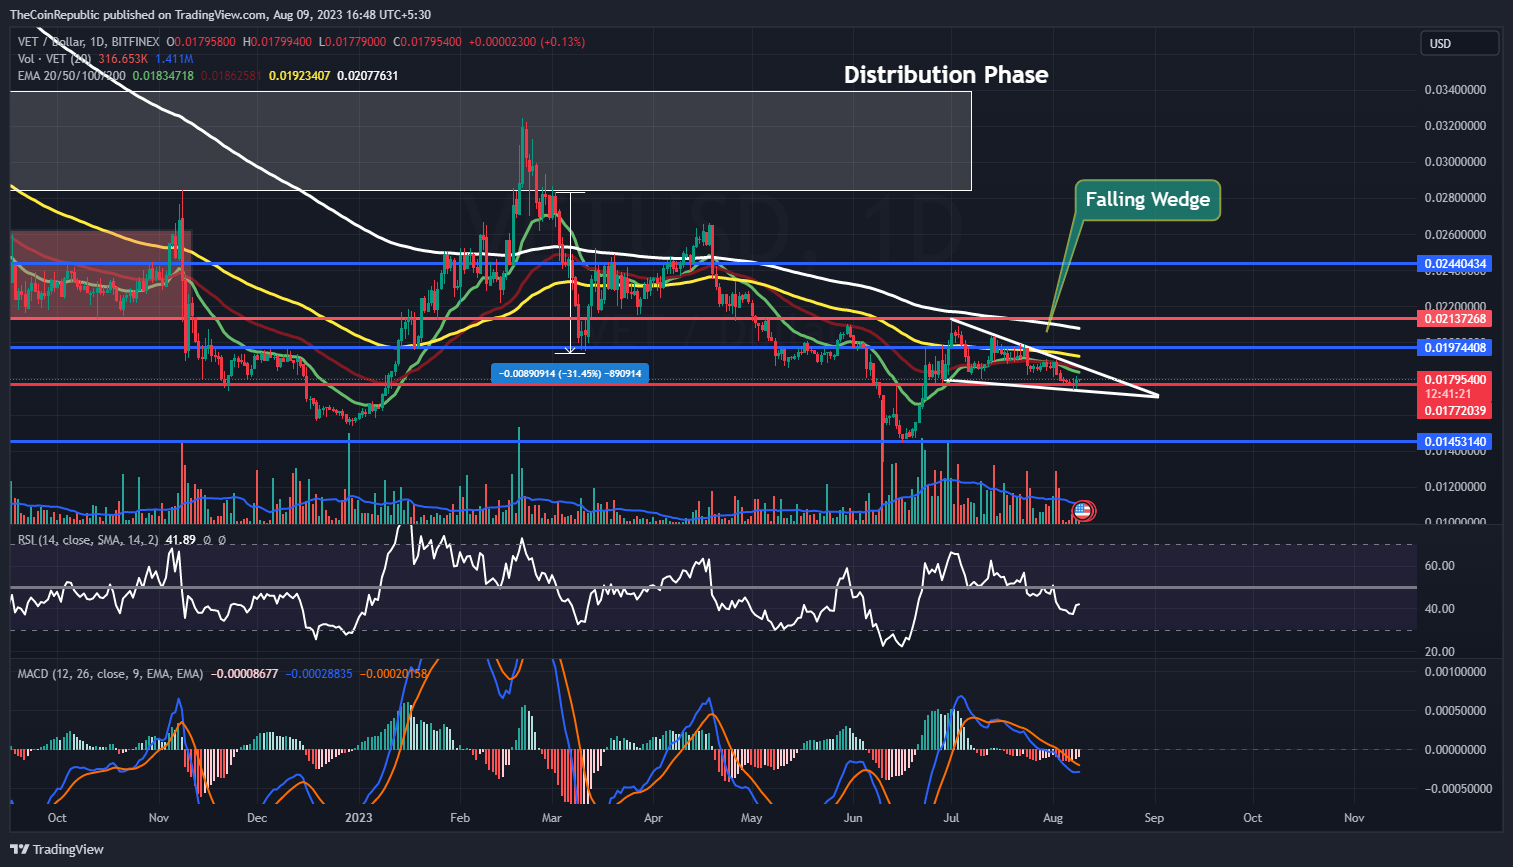
- 1 VeChain price prediction suggests the slippage of VET crypto inside a falling wedge pattern (press time).
- 2 VET crypto has slipped below 20, 50, 100 and 200-days daily moving averages.
- 3 VeCHain price has gained 13.29% year to date.
VeChain price prediction indicates a downtrend in a descending wedge pattern on the daily chart, requiring buyer intervention to break towards the upper trendline. Sellers are driving VET crypto closer to the wedge’s lower trendline, risking a pattern breakdown.
However, the situation is currently delicate, as sellers exert pressure on the VET crypto’s price, driving it closer to the lower trendline of the descending wedge pattern. If this downward momentum persists, it could lead to a potential breakdown of the pattern, resulting in further price depreciation for VeChain.
Buyers must step in to rescue VeChain by boosting purchasing activity, countering sellers, and potentially reversing the bearish momentum. The evolving situation hinges on buyer-seller dynamics within the wedge pattern, determining VeChain’s recovery or susceptibility to breakdown. Monitoring this interaction is crucial as it shapes VET’s near-term trajectory.
VeChain price was at $0.01795400 and has gained 0.13% of its market capitalization during the day’s trading session. Trading volume has increased around 4.87% during the intraday trading session. This demonstrates that buyers are trying to accumulate to push VET crypto upwards. Volume to market cap ratio was 2.19%.
VeChain Price Prediction: Technical Indications
 VET Crypto Escape Falling Pattern?">
VeChain price prediction indicates the downside trend of VET crypto price inside the falling wedge pattern. Meanwhile, VET crypto has slipped below 20, 50, 100 and 200-days daily moving averages. There is no significant change in volume.
Over the past week, the price of VeChain has experienced a decline of 5.37%, and within the last month, it has decreased by 3.61%. On a broader timeframe, the VET cryptocurrency has faced more substantial losses, with an 8.70% drop in the past three months and a slump of 22.81% over the past six months.
Despite these downward trends, there has been a positive development in the year-to-date performance, as VeChain price has managed to rebound by approximately 13.24% in 2023, giving signs of recovery for the VET cryptocurrency this year.
Technical indicators confirm the negative trend of VeChain price. Relative strength index (RSI) and moving average convergence divergence (MACD) both showcase the downtrend momentum of VET crypto.
RSI was at 41 and is heading towards the oversold territory. The MACD line is below the signal line after a negative crossover. Investors in VeChain cryptocurrency need to wait for any directional change over the daily time frame chart.
Summary
VeChain price prediction indicates a downtrend in a descending wedge pattern on the daily chart, requiring buyer intervention to break towards the upper trendline. Buyers must step in to rescue VeChain by boosting purchasing activity, countering sellers, and potentially reversing the bearish momentum. Volume change was insignificant in the period used for analysis. Technical indicators confirm the negative trend of VeChain price.
Technical Levels
Support Levels: $0.01792400 and $0.0173899
Resistance Levels: $0.01909281 and $0.01974408
Disclaimer
The views and opinions stated by the author, or any people named in this article, are for informational purposes only, and they do not establish financial, investment, or other advice. Investing in or trading crypto or stock comes with a risk of financial loss.
 thecoinrepublic.com
