The Bitcoin (BTC) price and the crypto market cap (TOTALCAP) are hovering just above support without initiating a significant upward movement. Synthetix (SNX) has created a bearish double-top pattern.
Worldcoin Token (WLD), a cryptocurrency project created by Chat GPT’s CEO, will go live today.
Crypto Market Cap (TOTALCAP) Hovers Above Support
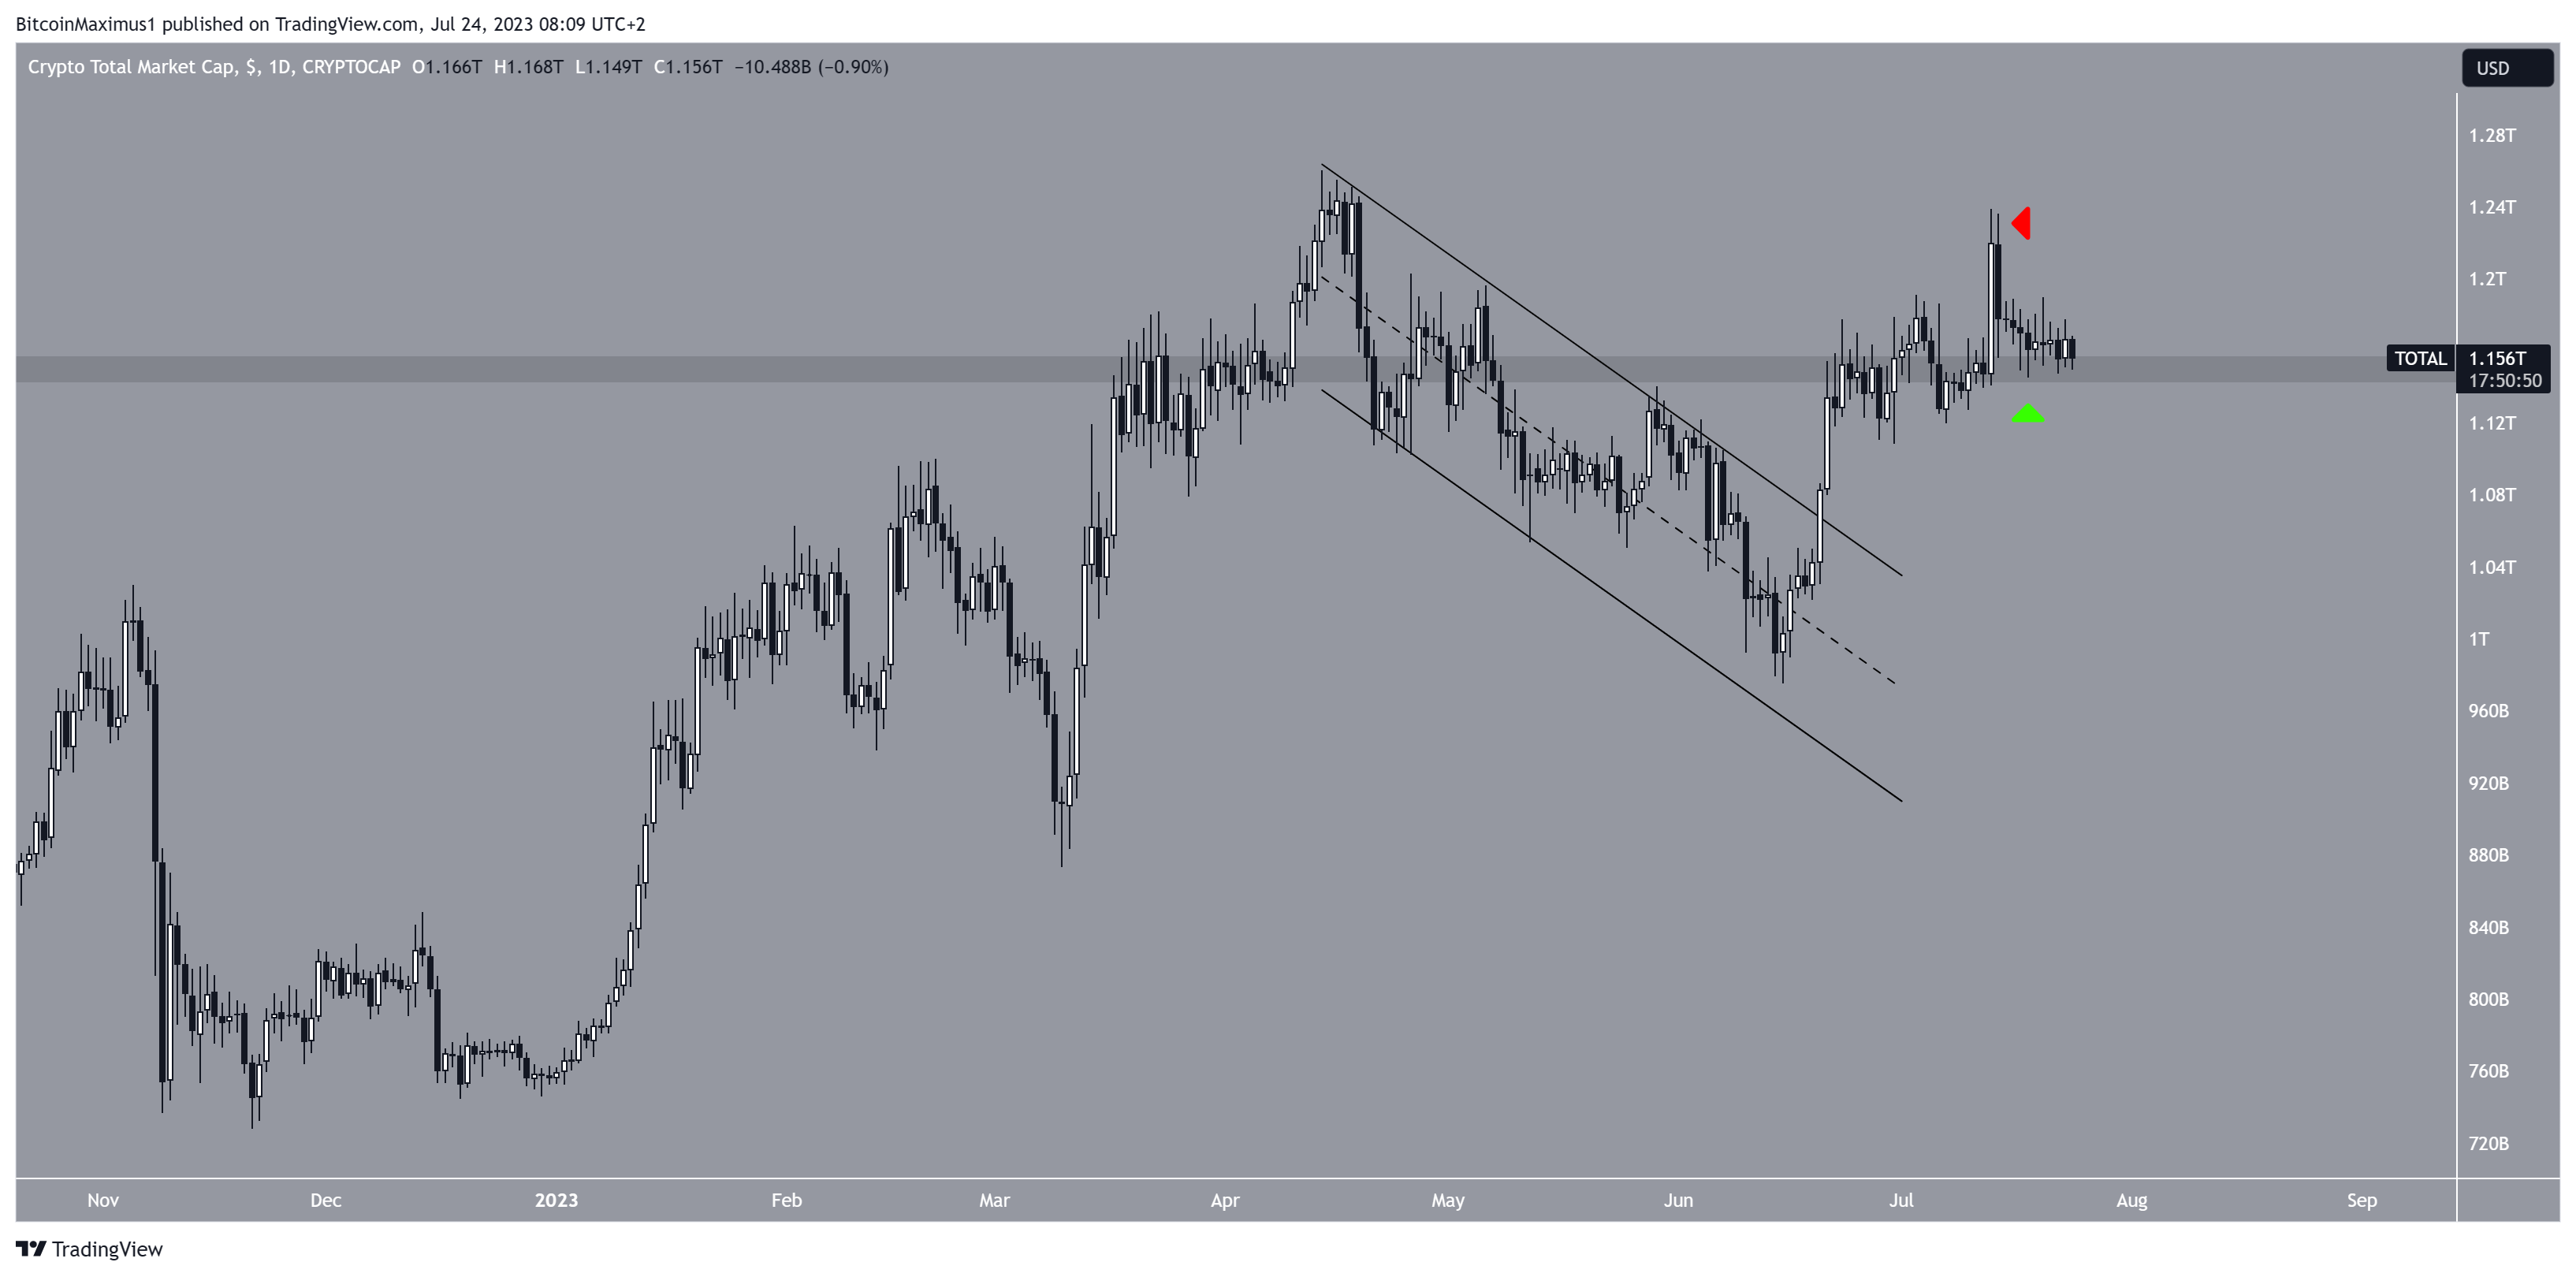
Starting from June 15, TOTALCAP has witnessed a significant upswing. By June 20, it surpassed a descending parallel channel and successfully broke through the $1.15 trillion resistance zone after a 10-day climb. On July 13, it almost reached a new yearly peak; however, it experienced a sharp subsequent downturn (red icon) that is still ongoing.
Notwithstanding this drop, TOTALCAP is currently trading above the $1.15 trillion mark, where it bounced back three days ago (green icon).

Should TOTALCAP breach this threshold, it is anticipated to decline further toward the subsequent support level at $1.05 trillion. On the other hand, a rebound may propel TOTALCAP’s potential rise to $1.50 trillion.
Read More: Bitcoin (BTC) Price Prediction
Bitcoin (BTC) Risks Breakdown From Corrective Pattern
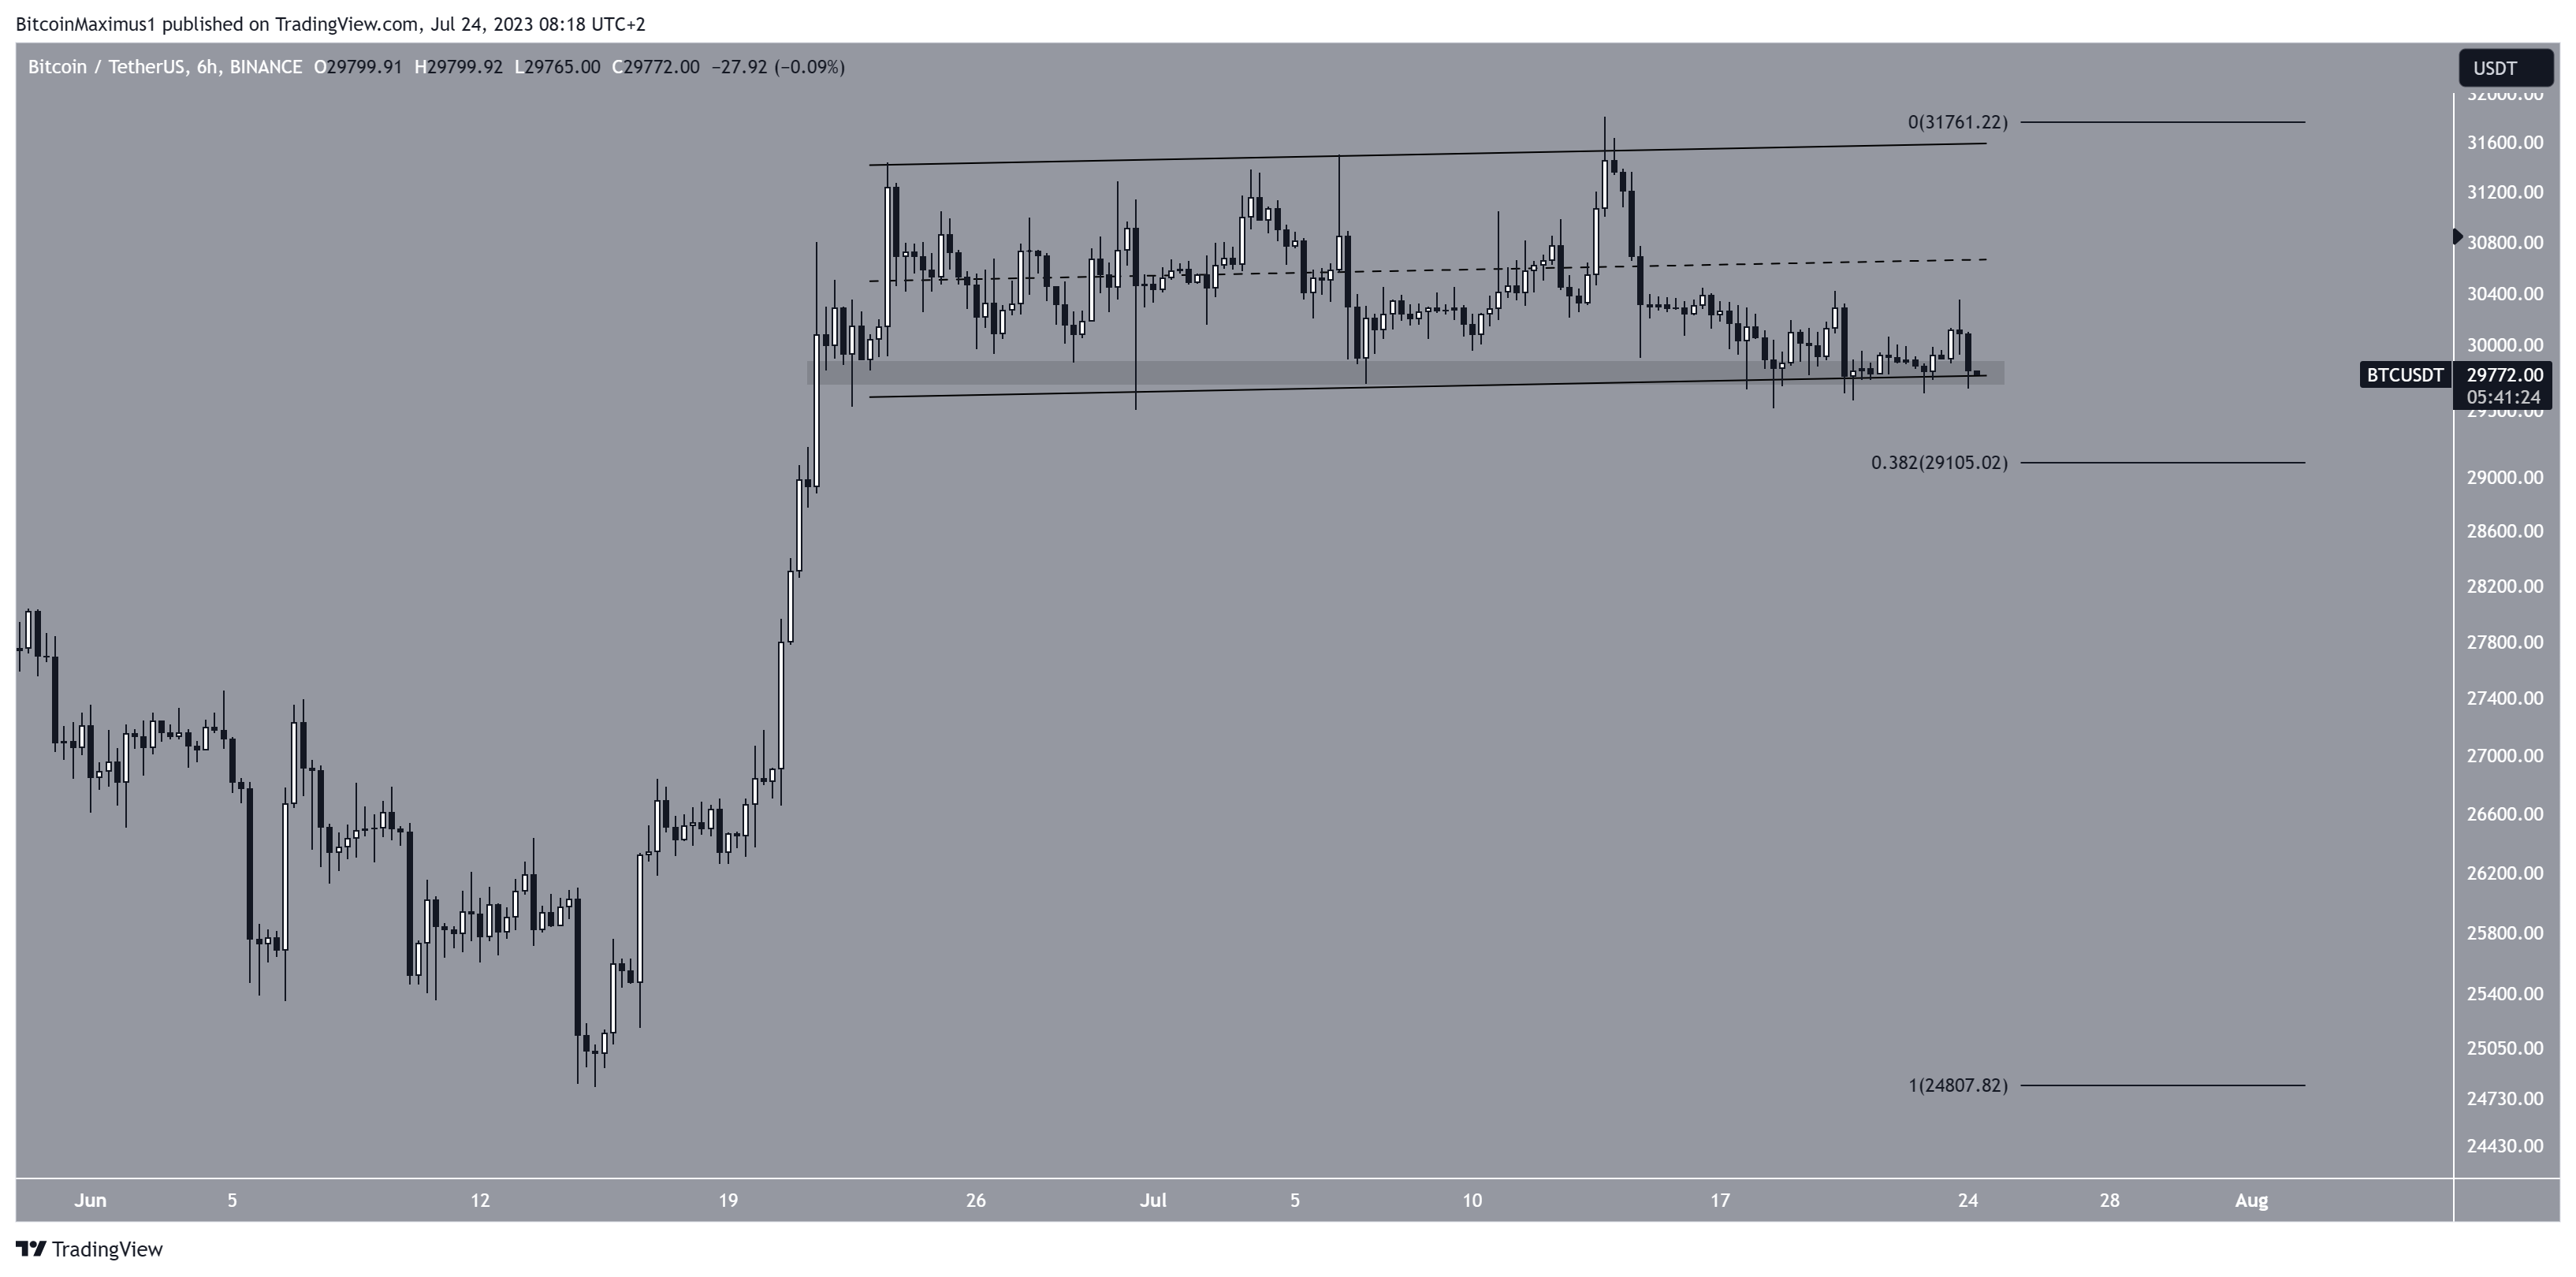
Starting on July 13, the price of BTC experienced a decline as it was unable to break through the resistance line of an ascending parallel channel. This led to the price reaching a low point of $29,512 on July 18.
After the drop, there was a rebound that served to validate both the channel’s support line and the horizontal support area at $30,000. However, as of now, the price has not shown a strong upward trend. On the contrary, BTC is hovering just above the confluence of support levels.

Should there be an upward movement, there is a possibility for the price to rise towards the channel’s midline, with the potential to reach the resistance line at $31,500.
Conversely, if the BTC price breaks down, it is anticipated to decrease to $29,100. The 0.382 Fibonacci retracement support level establishes this particular support level.
Read More: Best Upcoming Airdrops in 2023
Synthetix (SNX) Price Shows Weakness
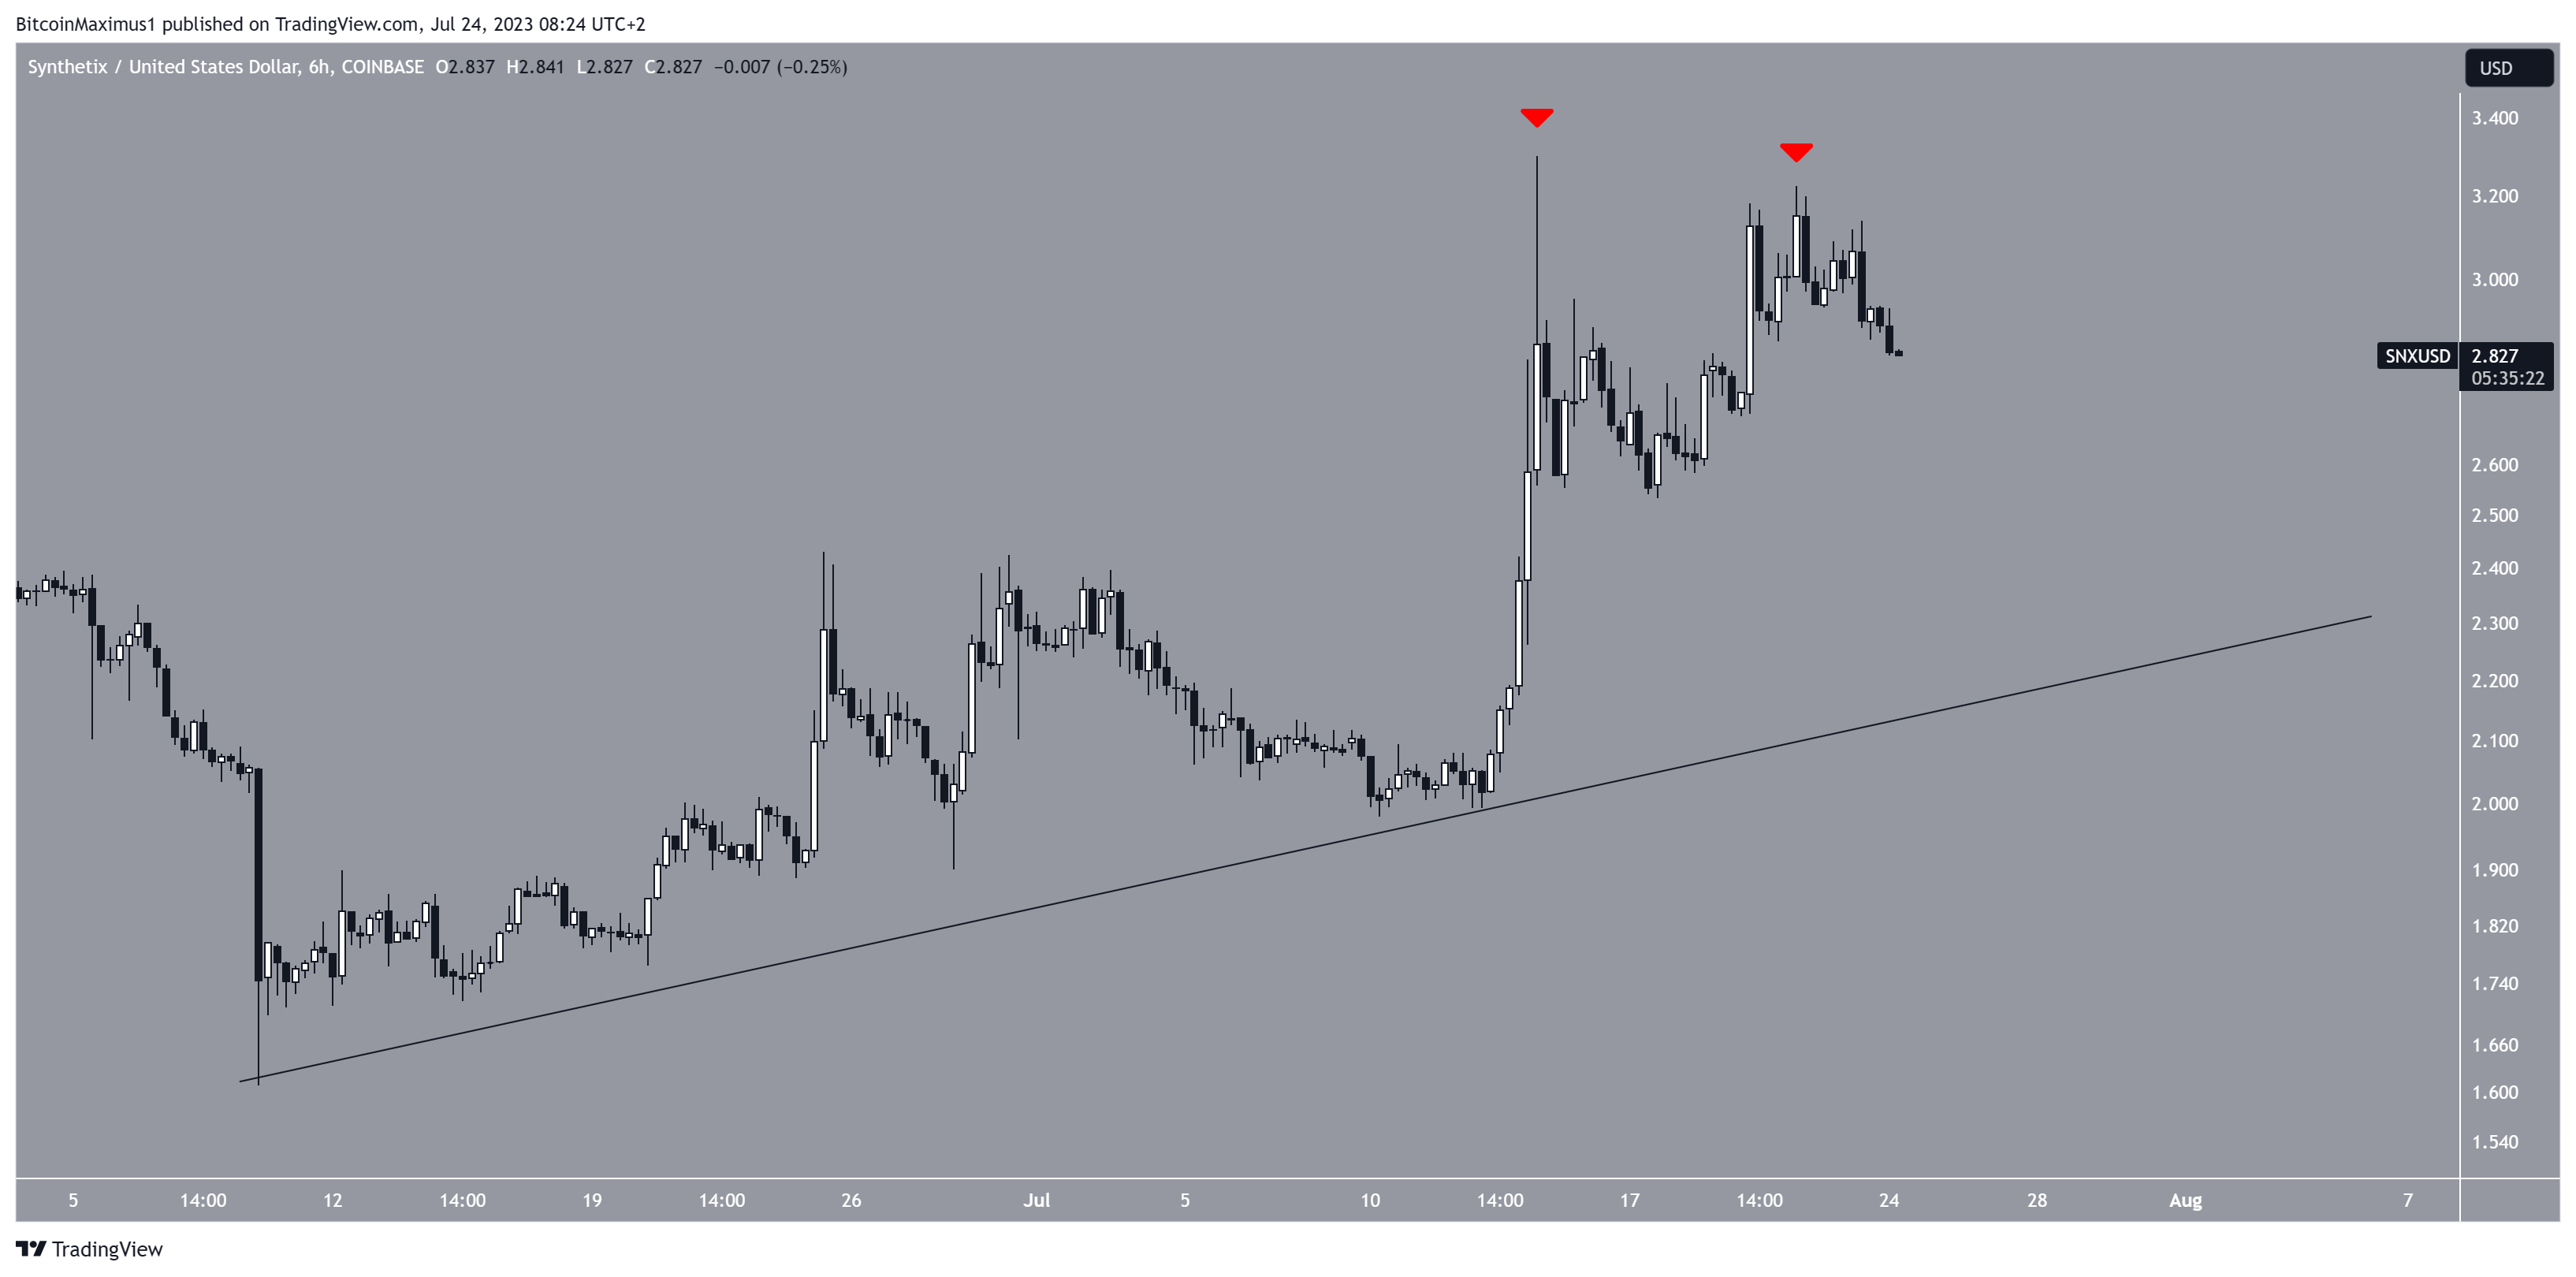
The SNX price has increased alongside an ascending support line since June 10. The upward movement led to a high of $3.30 on July 14. However, the price has fallen since. While it attempted to initiate another upward movement, the price created a double top on July 21 (red icons). This is considered a bearish pattern.

If a decrease occurs as a result of the double top, the SNX price could fall to the ascending support line at $2.30. However, an increase to $4 could transpire if the price recovers and breaks out.
 beincrypto.com
