Stellar ($XLM) is basking in the glow of Ripple's partial win against the U.S. Securities and Exchange Commission (SEC), up around 60% since the court ruling on July 13.
$XRP fuels $XLM price rally again
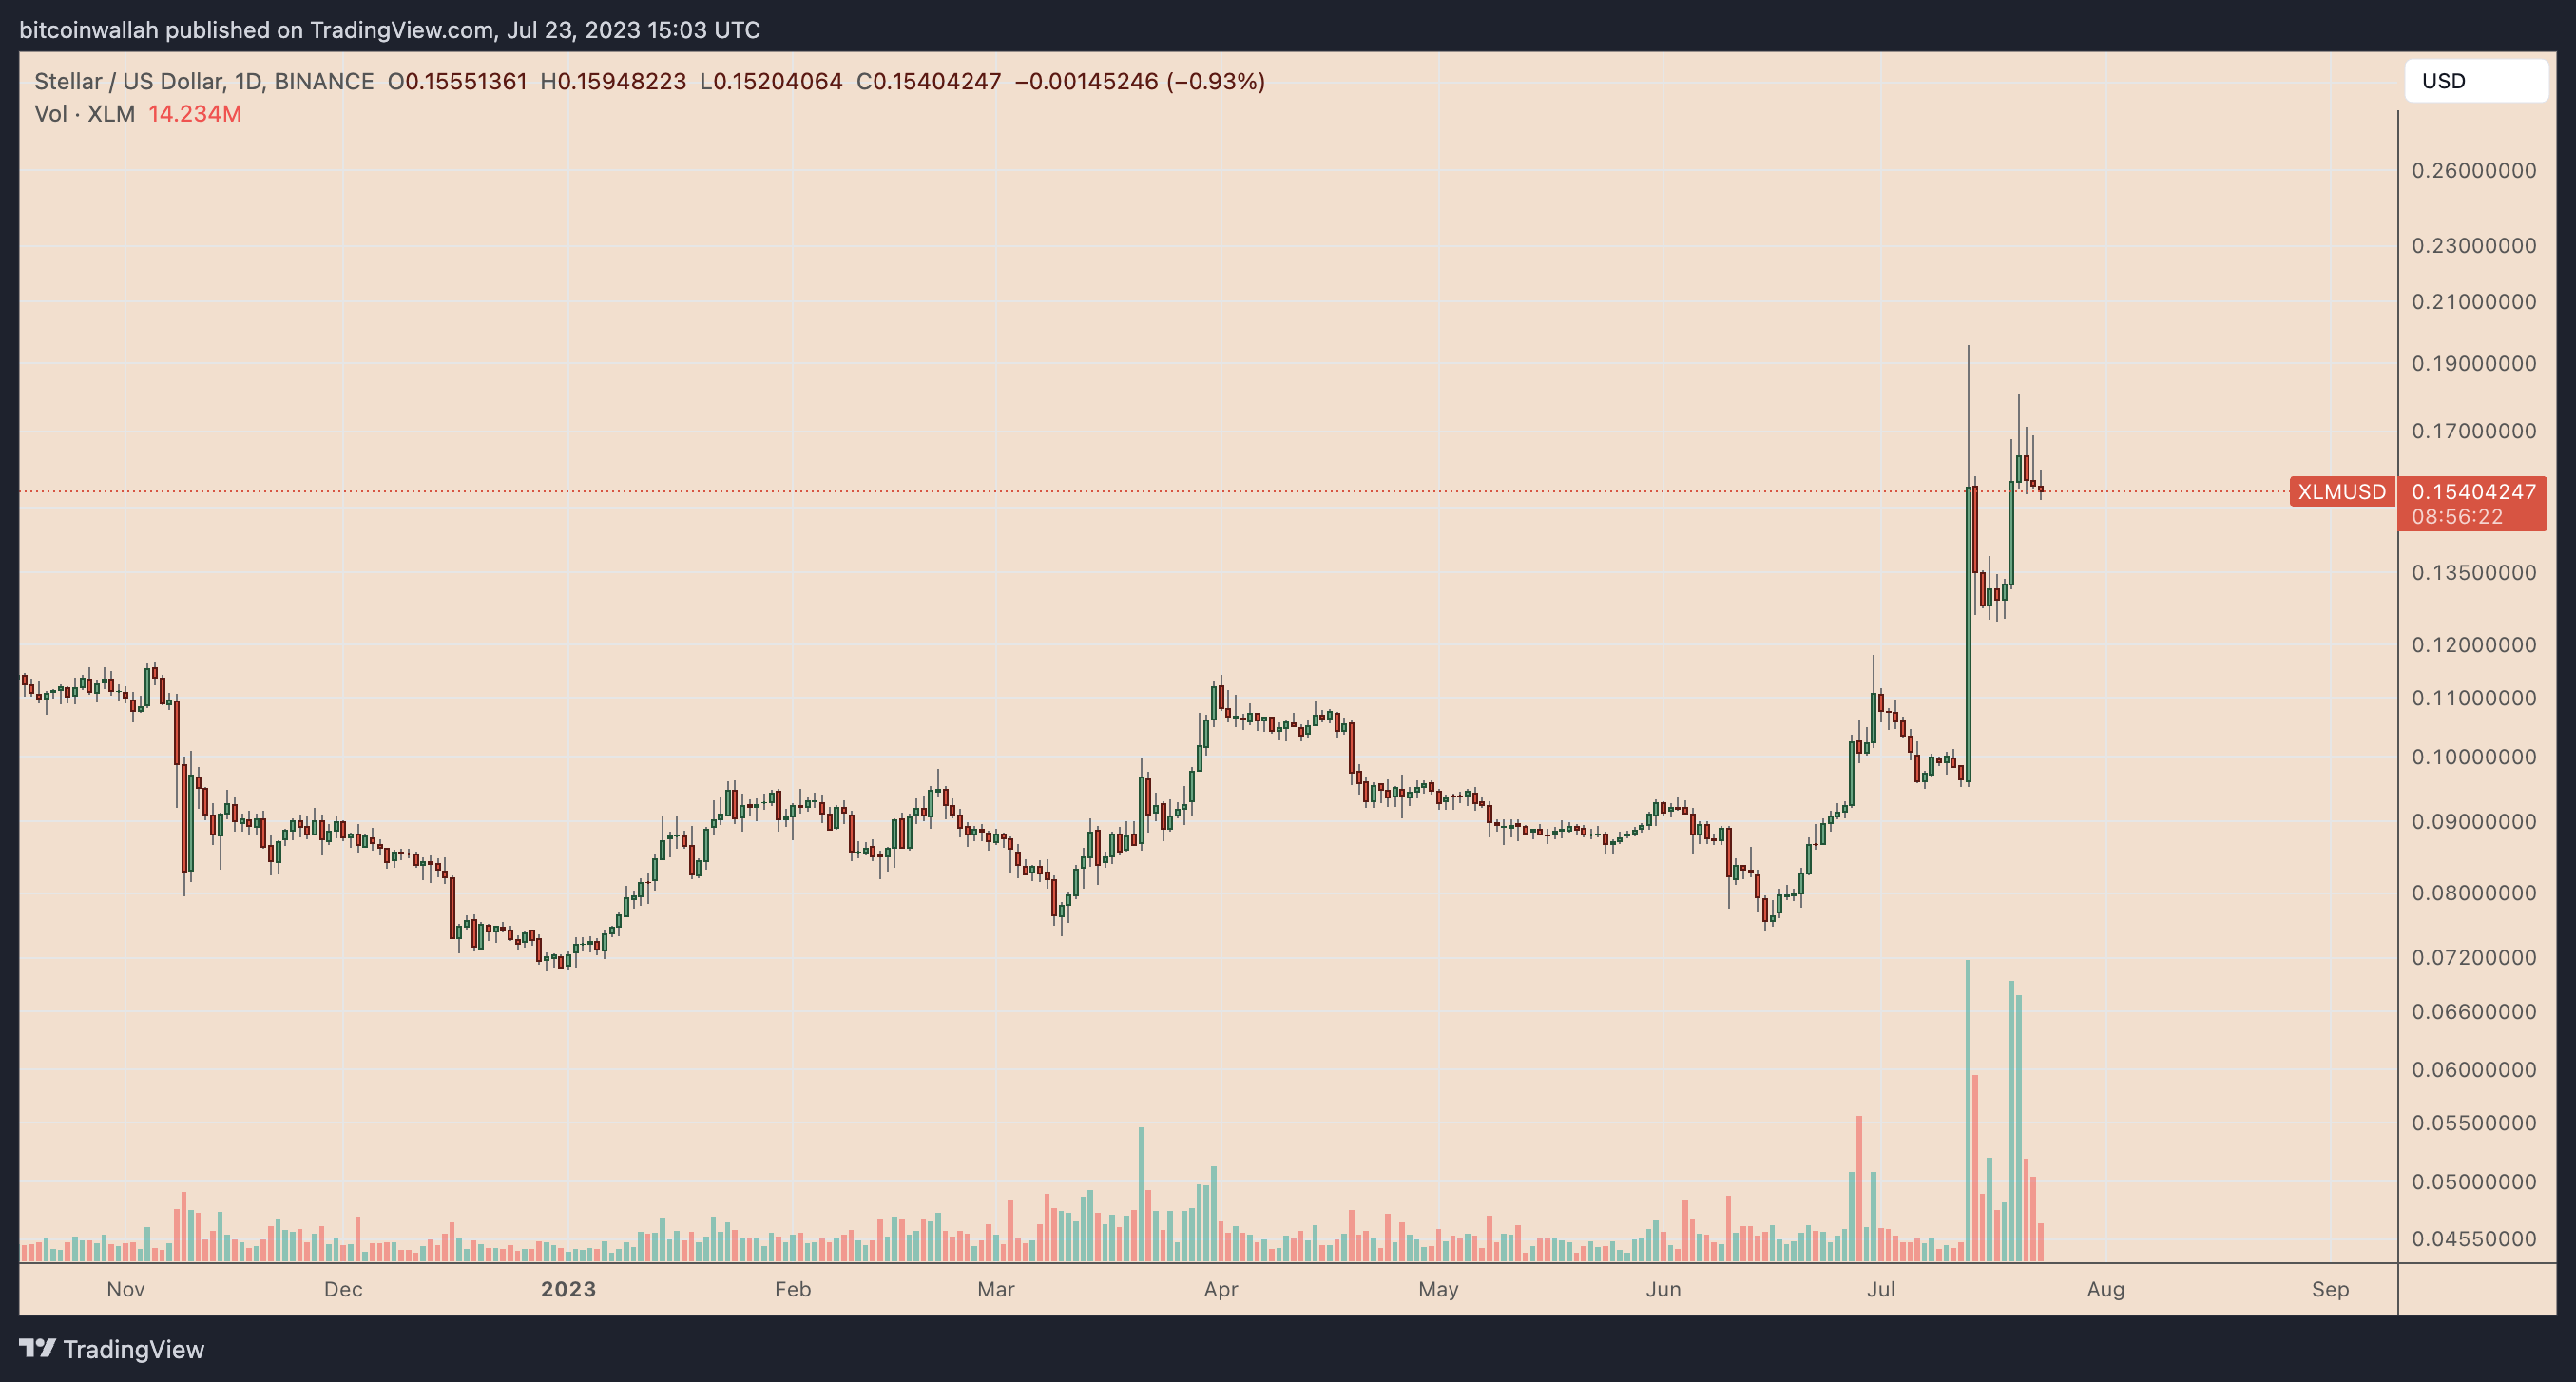
$XLM price has risen over 60% since July 13, when a federal judge ruled that the $XRP sales on public exchanges did not break U.S. securities laws. Still, the token is down about 20% from its local peak of $0.195 and was changing hands for about $0.154 on July 23.
The period of $XLM's price rise has appeared alongside the token's growing positive correlation with $XRP on the daily timeframe. As of July 23, the correlation coefficient between the two assets was 0.95, suggesting they are moving in a near-perfect tandem.
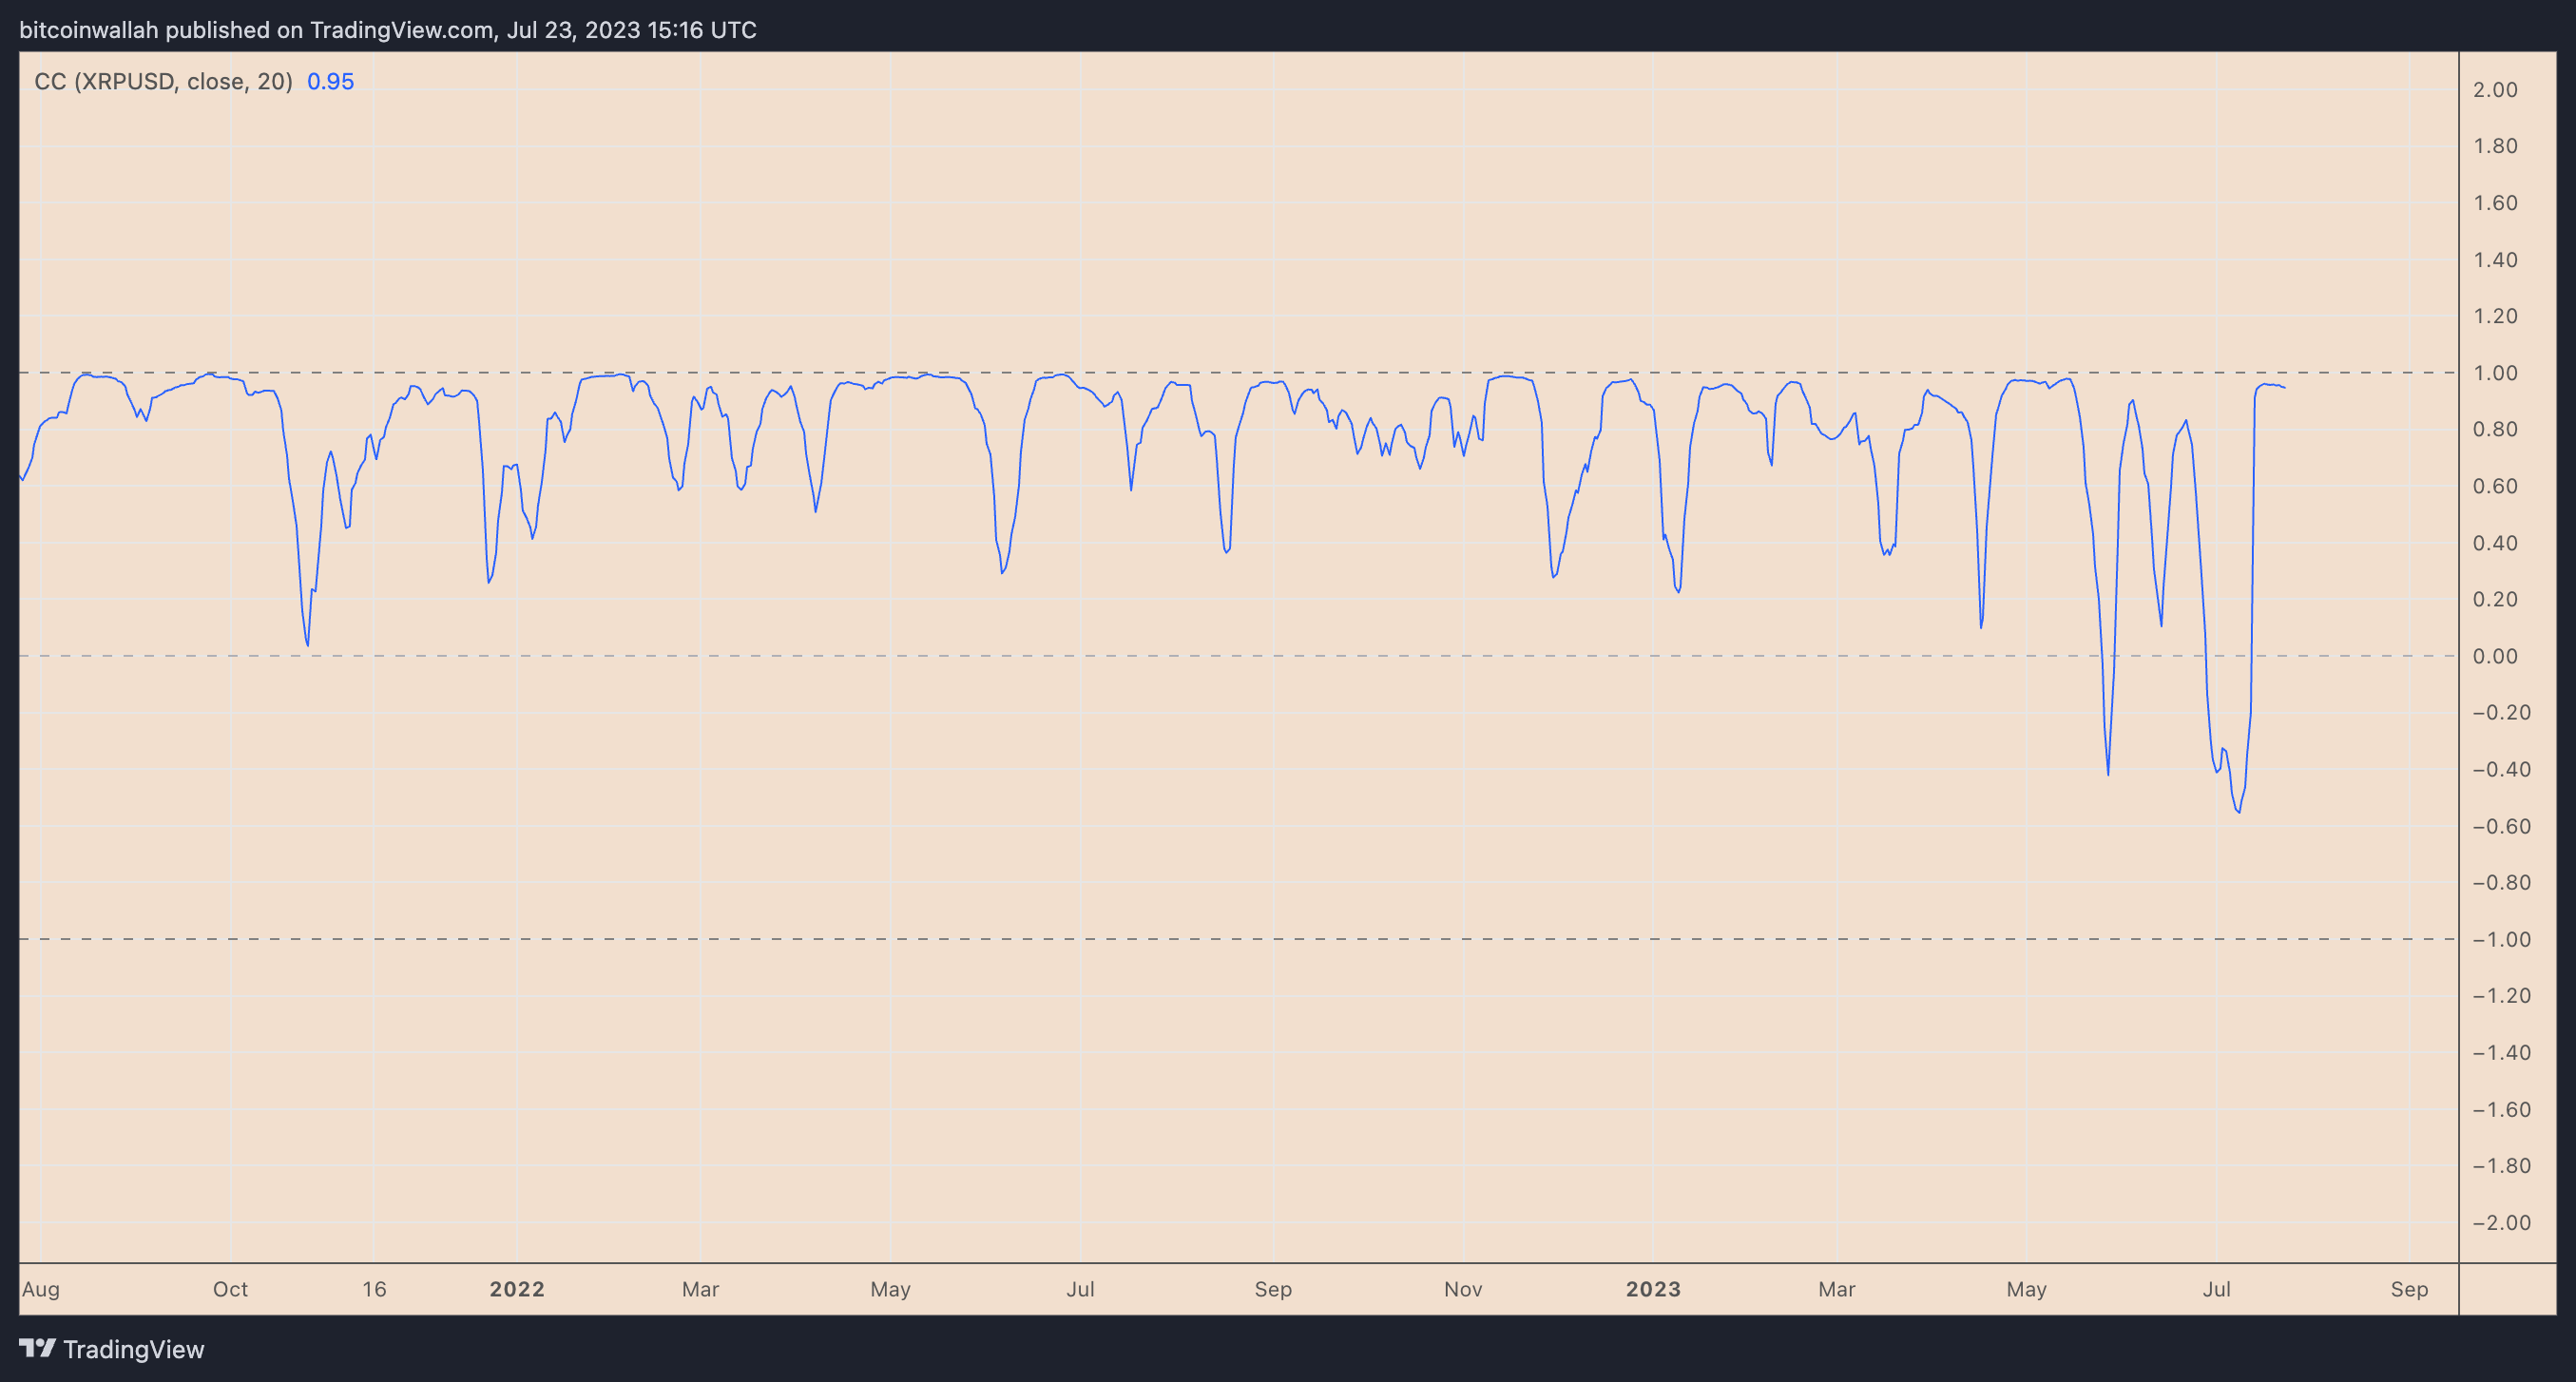
The price trends in $XLM and $XRP markets typically mirror one another, given Stellar is a breakaway blockchain payment project founded by Ripple's co-founder Jed McCaleb. For instance, $XRP's price has also surged around 60% since the Ripple win.
But $XRP price risks dropping approximately 40% by September, which will likely put $XLM under similar bearish stress.
$XLM most overbought since April 2021
From a technical perspective, the latest $XLM price rally has pushed the market's weekly relative strength index (RSI) to its most overbought levels since April 2021.
Related: $XRP price searches for a fresh bullish catalyst to trigger a move above $1
As of July 23, $XLM's weekly RSI was around 72.5. Additionally, the token trades near a strong resistance confluence comprising of its 200-week exponential moving average (200-week EMA; the blue wave) and a horizontal line (purple) near $0.164.
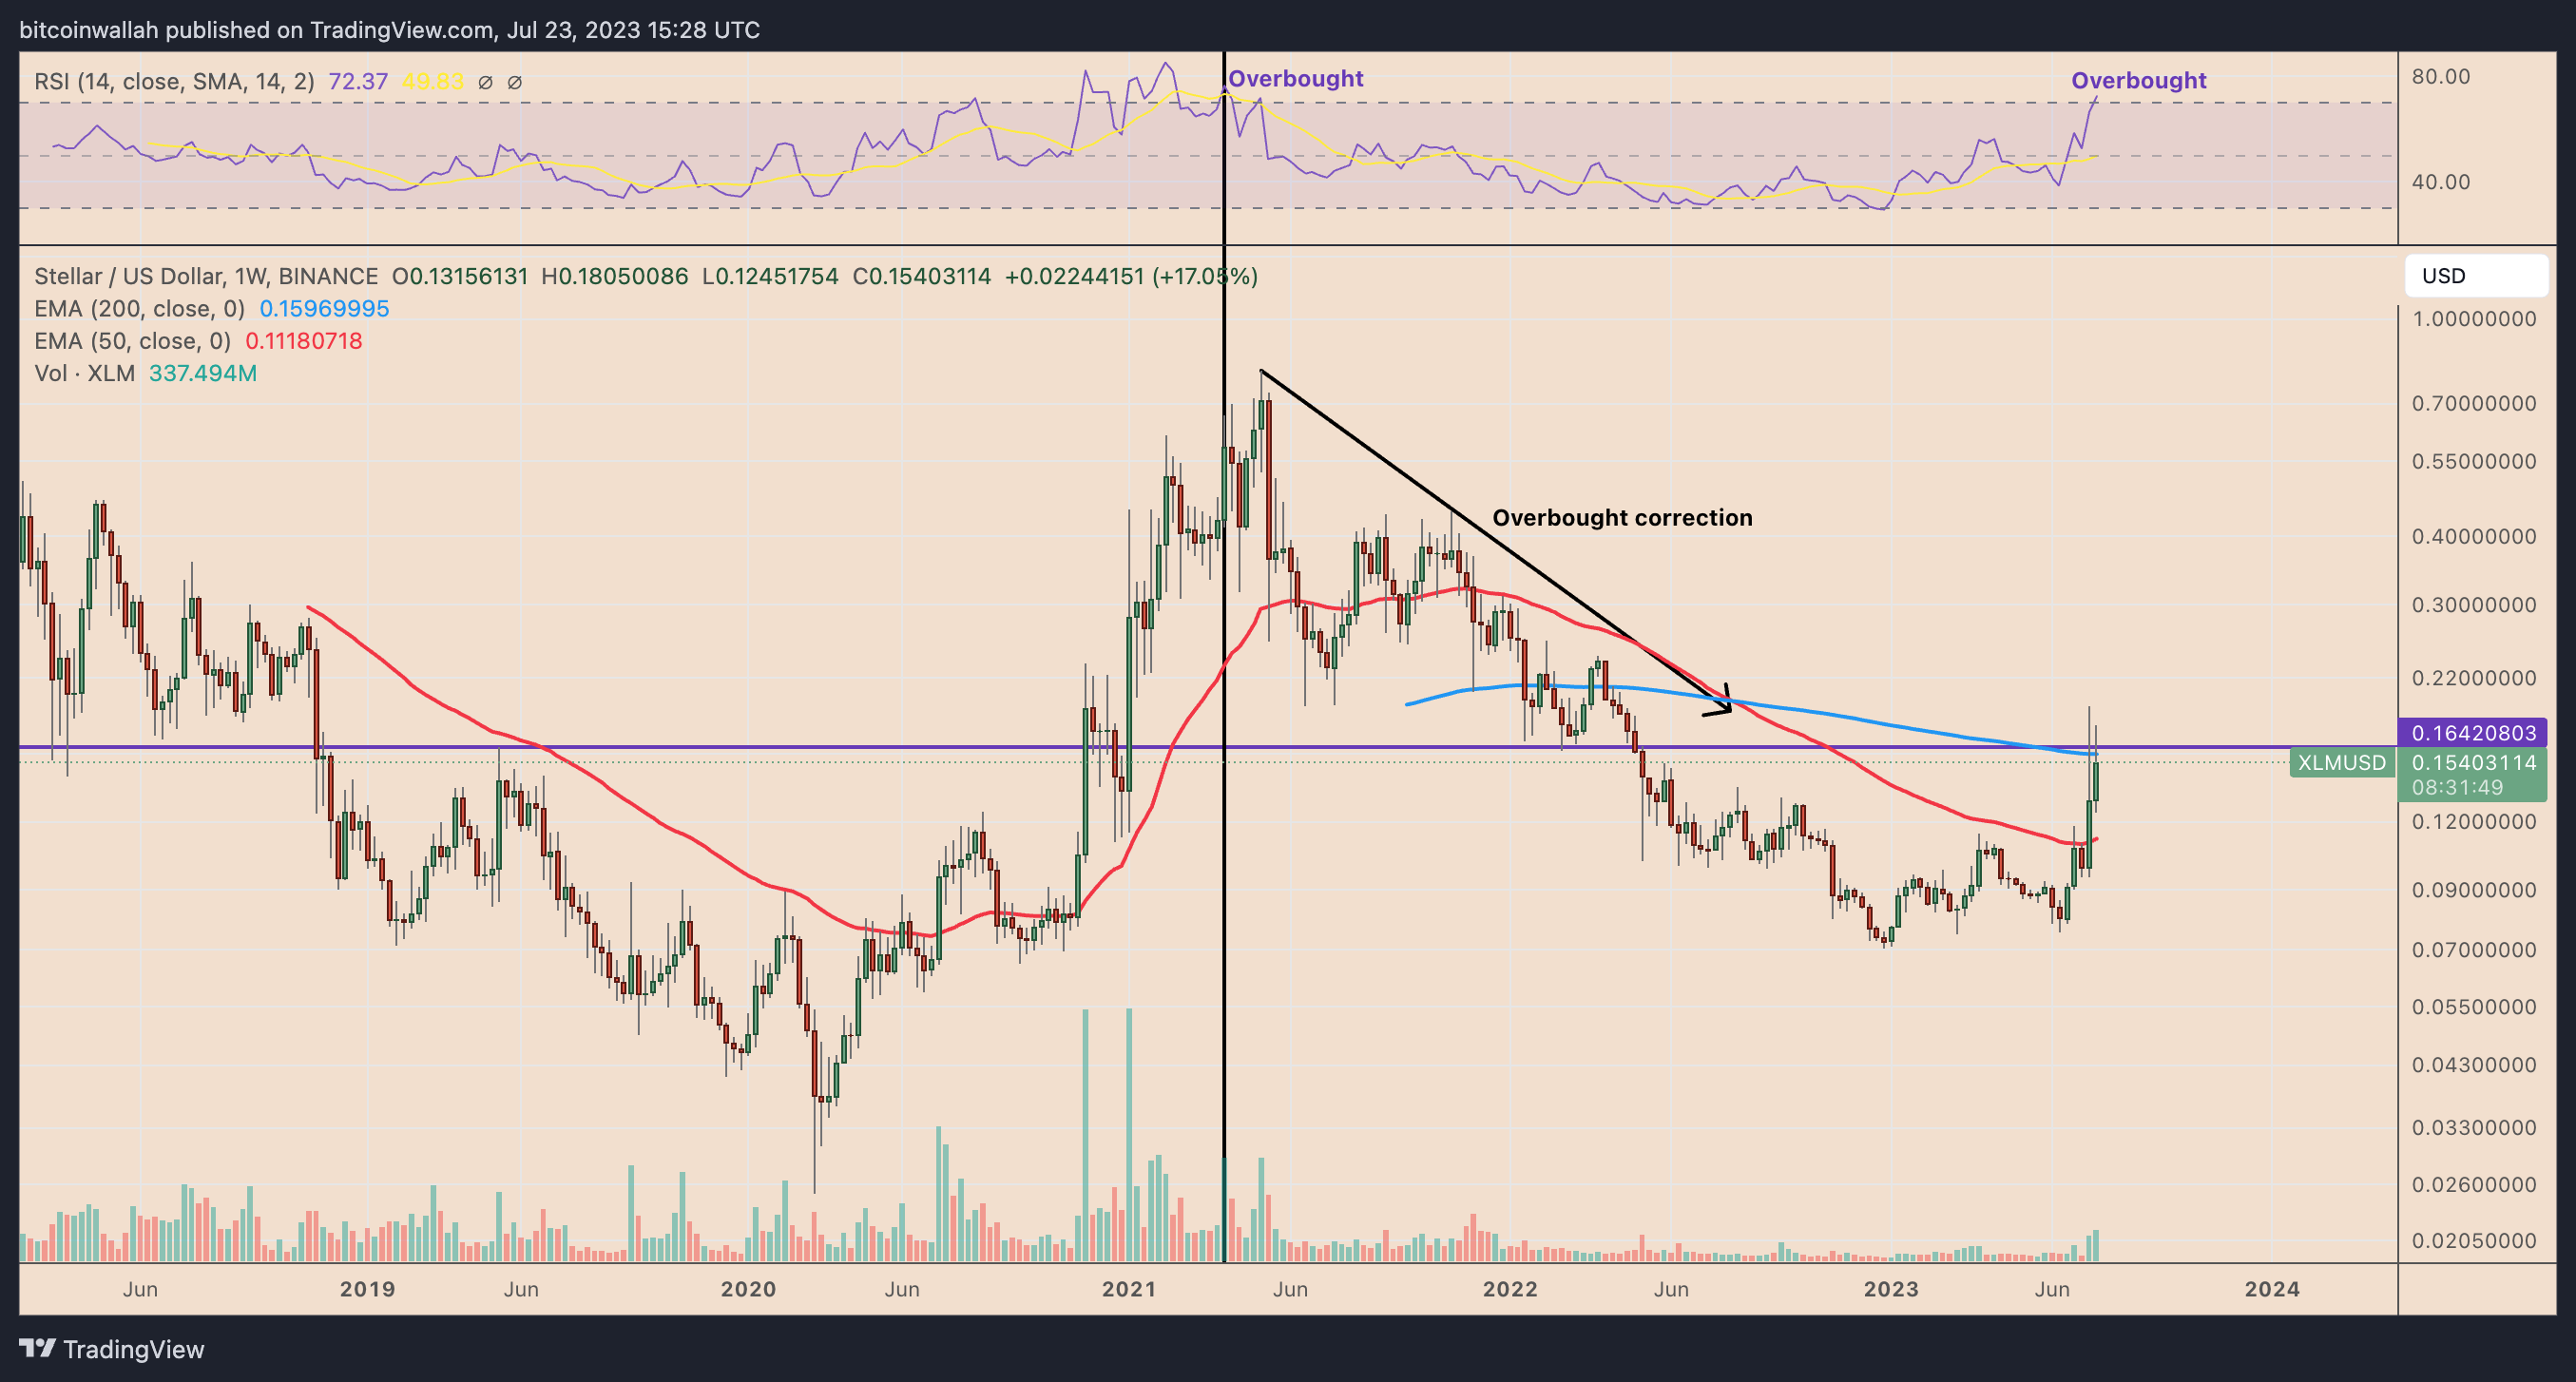
The indicators raise $XLM's prospects of undergoing a sharp price correction in the coming weeks.
In this bearish scenario, $XLM price could decline toward its 50-week EMA (the red wave) near $0.111 by September, down 30% from current price levels.
This level also coincides with $XLM's support during the May-November 2022 session.
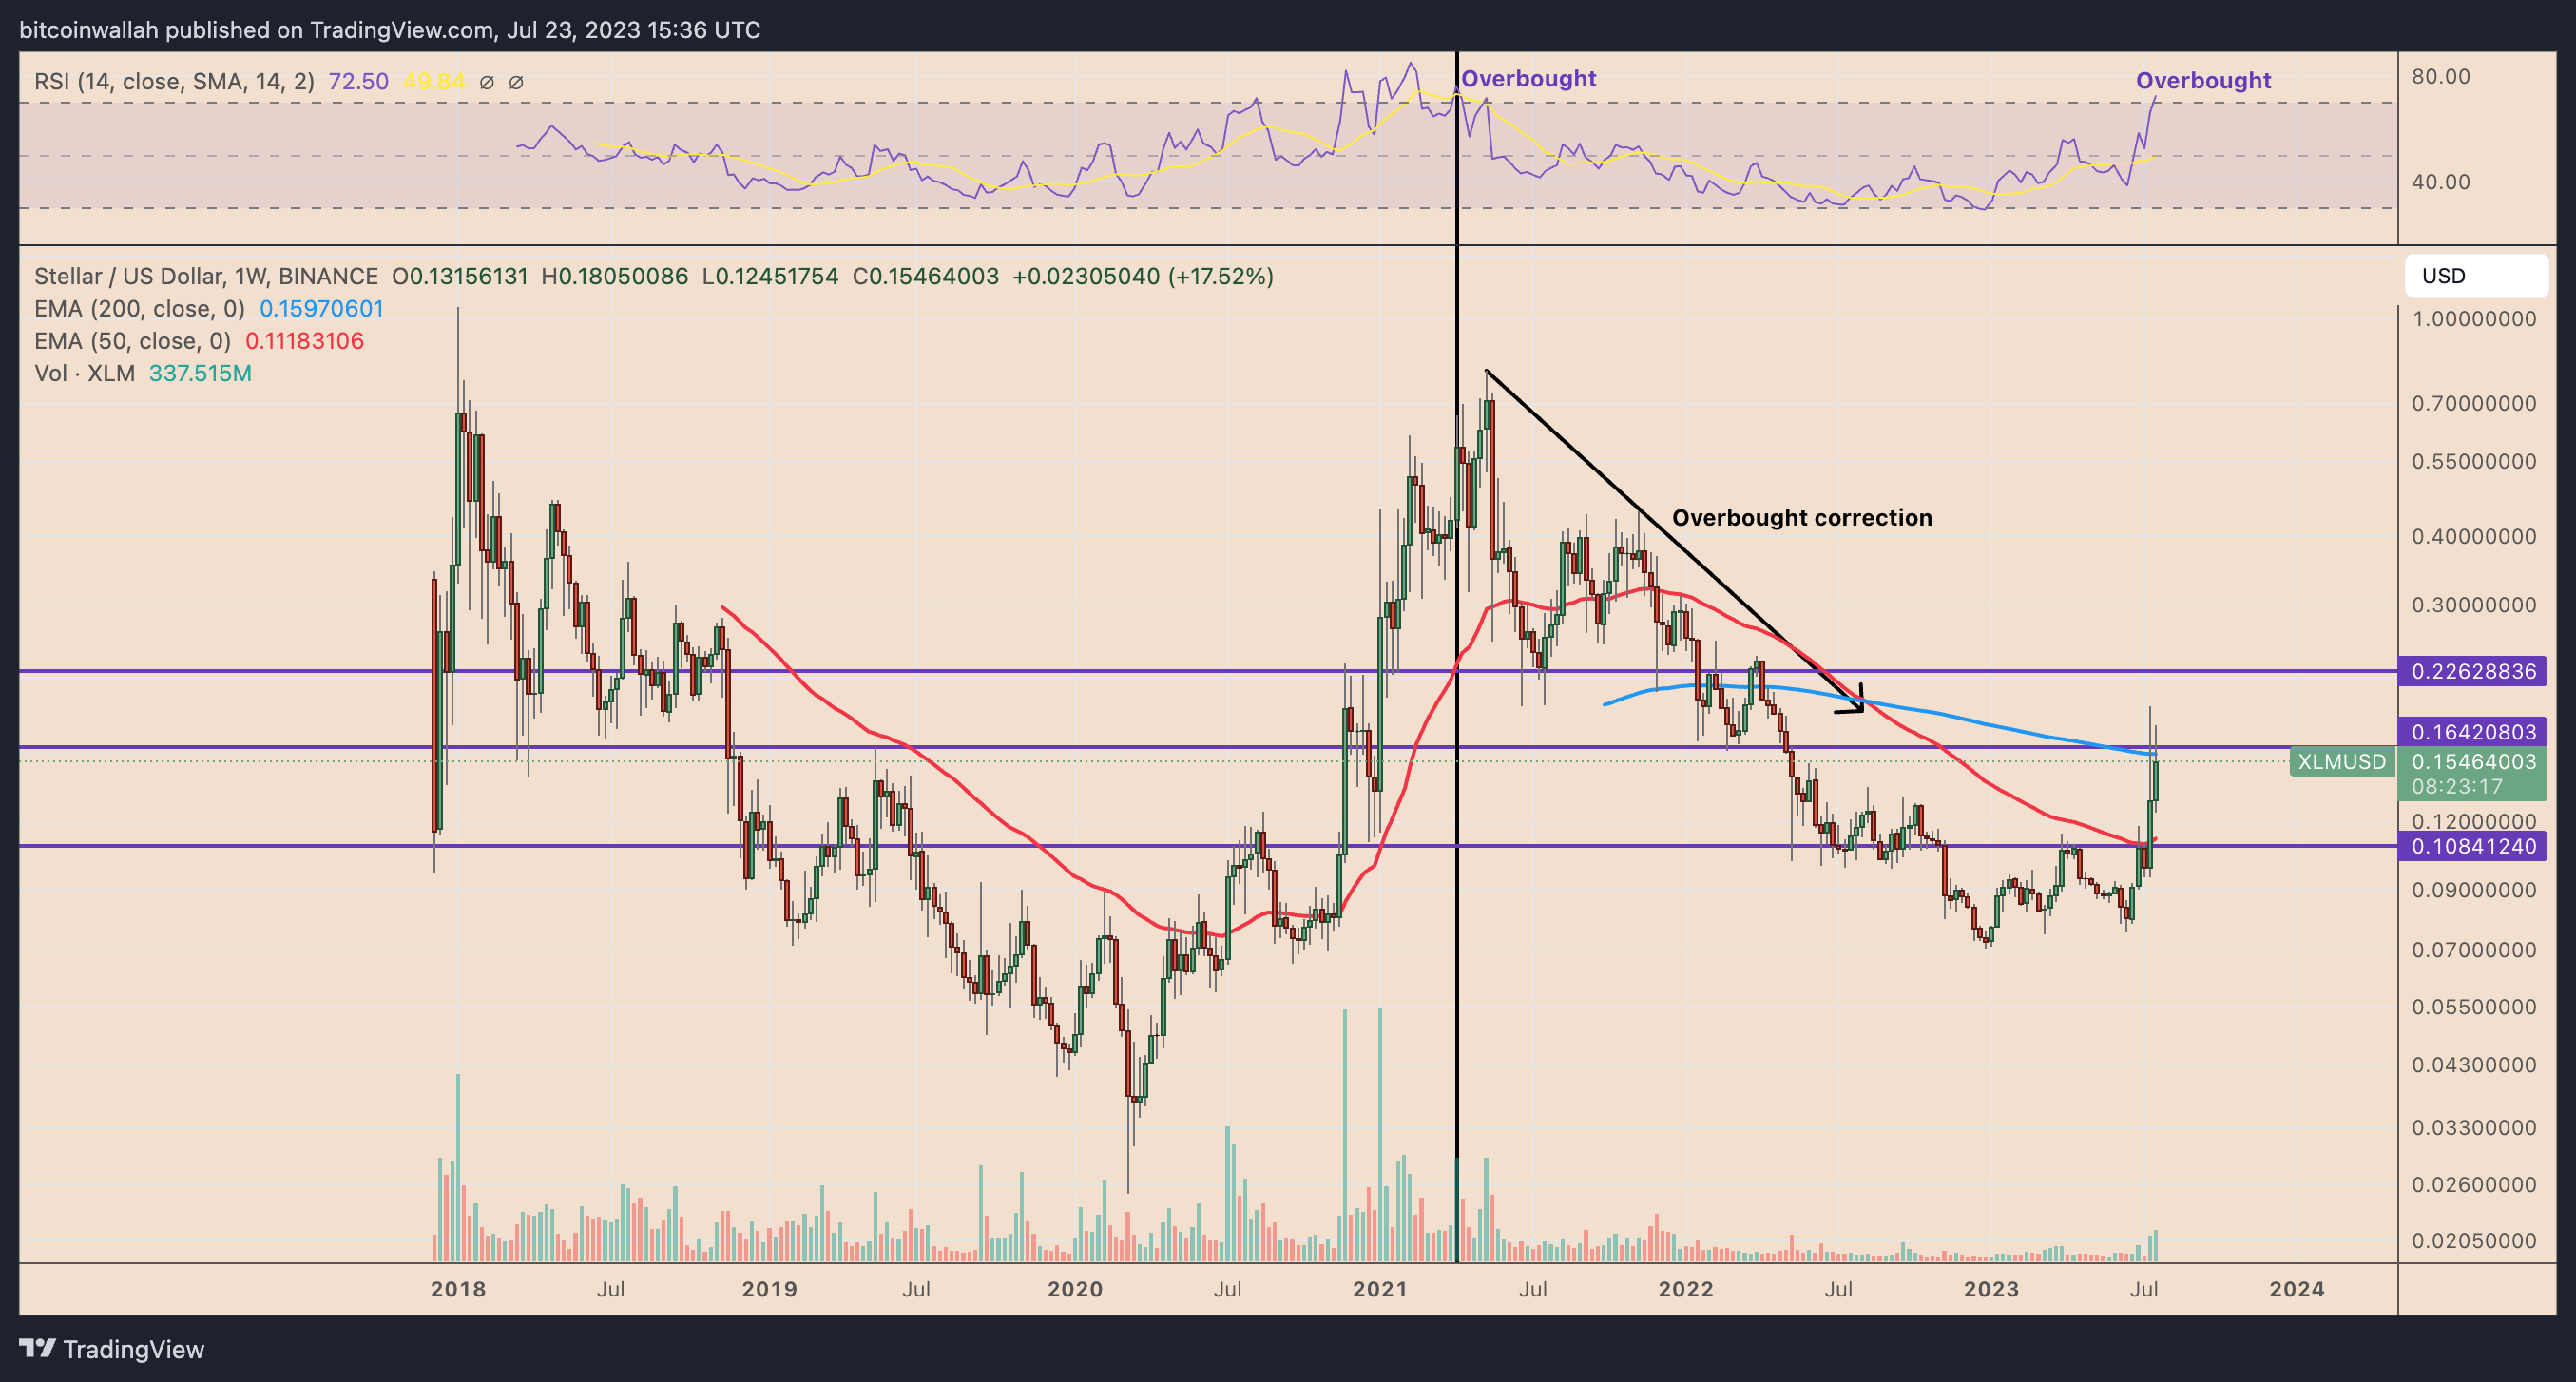
Conversely, a decisive close above the resistance confluence could have $XLM/USD rally toward $0.22 by September, up 45% from current price levels. This level served as support and resistance in June 2021-April 2022.
This article does not contain investment advice or recommendations. Every investment and trading move involves risk, and readers should conduct their own research when making a decision.