Bitcoin (BTC) price continues its consolidation below $30,000 as the price of BTC/USDT struggles to break above the key resistance of $31,500, acting as resistance for bulls as bears look for opportunities to push the price of BTC/USDT below $28,500.
Ripple-related (XRP) lawsuits have been a major catalyst for the crypto market in recent weeks, sparking the idea that the bull run could be knocking at the threshold of its breakout after a long winter period for many traders.
Although the market continues to see prices consolidate, there have been special crypto performers such as Maker DAO (MKR), Ripple (XRP), and others. Here are the best 5 cryptos (BTC, ETH, DOGE, PEPE, LINK) to watch for the week.
The crypto market continues to look less bullish for the bulls as the bears take the market heading into the weekend by the horn, according to the heatmap on Coin360, suggesting just a few special coins have performed better, highlighting why these coins are the best 5 cryptos to watch for the weekend.
Best 5 Cryptos – Bitcoin Daily (1D) Price Analysis

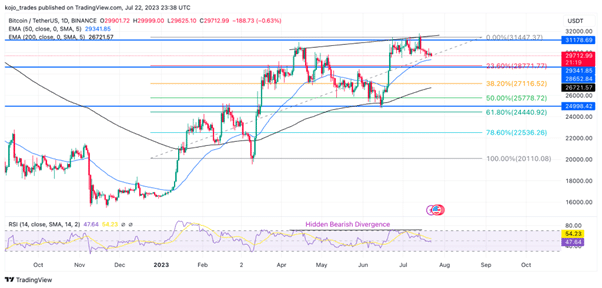
The price of Bitcoin (BTC) has remained in range or consolidation below $31,500 as bulls were unable to break above this region on several occasions as bears could look for opportunities to push the price of BTC/USDT below key support areas of $29,500 and $28,500.
BTC/USDT price needs to hold above the region of interest for Bitcoins bulls to avoid the bear taking full control of the market that has shown great price actions for months now.
After forming good support at $20,000, the price of BTC/USDT rose with much steam to a high of $31,500 but was quickly rejected by the bears looking to buy on the cheap.
The daily (1D) timeframe for the Relative Strength Index (RSI) suggests a hidden bearish divergence for the bears as the price could retest the minor support just above the 50-day Exponential Moving Average (EMA) of $29,500.
If the bulls fail to hold the price of BTC/USDT above $29,500 and $28,500, we could see price retesting lows of $27,000, just above the 38.2% Fibonacci Retracement Values (Fib Values).
The price of BTC/USDT pulling towards the Fibonacci levels of 23.6% and 38.2% suggests a healthy price retracement for bulls before the price continues to the upside.
Bulls would love to see the BTC/USDT price hold above $29,500 and possibly breakout from its range to a high of $35,000 after its price consolidation.
Daily (1D) Timeframe For Ethereum Price Chart

The price of Ethereum (ETH/USDT), just like its counterpart, has struggled to clear the highs of $1,950 as bulls get rejected from its key resistance that could see the price of ETH/USDT rally with much momentum if the price breaks above this region.
The major level for the bears to open a short position has been $1,950 as bulls prefer to open a long position in the region of $1,770, just above the 200-day Exponential Moving Average (EMA) acting as demand and support zone for bulls.
If the price of ETH/USDT closes below this region of $1,770, acting as a key support zone for bulls, the bear would fully take control of the market as it could push the price of ETH/USDT to a low of $1,600.
The Fibonacci retracement value of 38.2%, which corresponds to the price of $1,850, suggests ETH/USDT needs to hold this region to avoid being pushed lower.
ETH/USDT pair currently trades below the 50-day EMA and the RSI 50 mark, indicating low buy orders, which could be a worry for bulls entering a new week as one of the best 5 cryptos to watch.
Daily Major resistance for ETH/USDT – $1,950
Daily Major support for ETH/USDT – $1,770
RSI value below 50
Chainlink (LINK) Daily (1D) Price Analysis

Chainlink (LINK) has emerged as one of the best 5 cryptos to pay close attention to in the coming days and months as this great token has struggled to break out of its range of over 400 days of price range within a region of $5 and $9.5.
Onchain data analytics suggest the price of LINK/USDT in the past few days has gained much volume as bulls could be set to finally break past LINK’s major resistance of $9.5, holding the price of LINK/USDT from rallying higher.
The daily price chart for LINK/USDT suggests the price looks healthy and favours bulls as the price of LINK is currently trading at $7.8 above the 50 and 200-day EMA acting as support zones for LINK price.
The RSI value for LINK trades above 70 indicates higher opportunities for a long position than for bears looking to lower prices.
Daily resistance for LINK/USDT – $9.5
Daily Support for LINK/USDT – $5
RSI Value above 70
Dogecoin (DOGE) Daily Chart Analysis

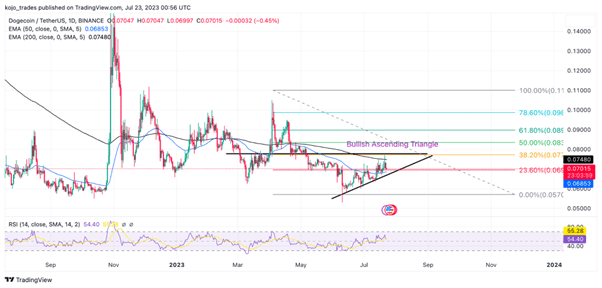
After forming good support at $0.06, the price of DOGE/USDT bounced off this region as this has proven to be a demand zone for the bulls.
The price of DOGE bounced to trend higher as it formed a bullish ascending triangle indicating bulls have much more control over prices than bears.
The price of DOGE/USDT needs to break and hold above $0.08, corresponding with the FIB value of 38.2%, as this has proven to be a tough resistance for Dogecoin bulls.
A break and close above the high of $0.08 could see bulls pushing the price to a yearly high of $0.1 to $0.15, corresponding to the FIB value of 78.6%.
Daily DOGE/USDT resistance – $0.08
Daily DOGE/USDT Support – $0.06
PEPE Daily Price Analysis

PEPE coin has remained a hot topic for many crypto traders as one of the best 5 cryptos, considering how much potential it possesses for bulls who have gained much from its price action within a short time.
The price of PEPE/USDT sits above the support of $0.00000140, which corresponds with the 38.2% FIB value. After forming support at $0.00000090, the price of PEPE has remained bullish on all timeframes as the price struggles to break above $0.000002.
A break above the region of $0.000002 for PEPE/USDT could see the price rallying with much force to a high of $0.000004 as many would be cut in the euphoria of making life-changing money.
 thecryptobasic.com