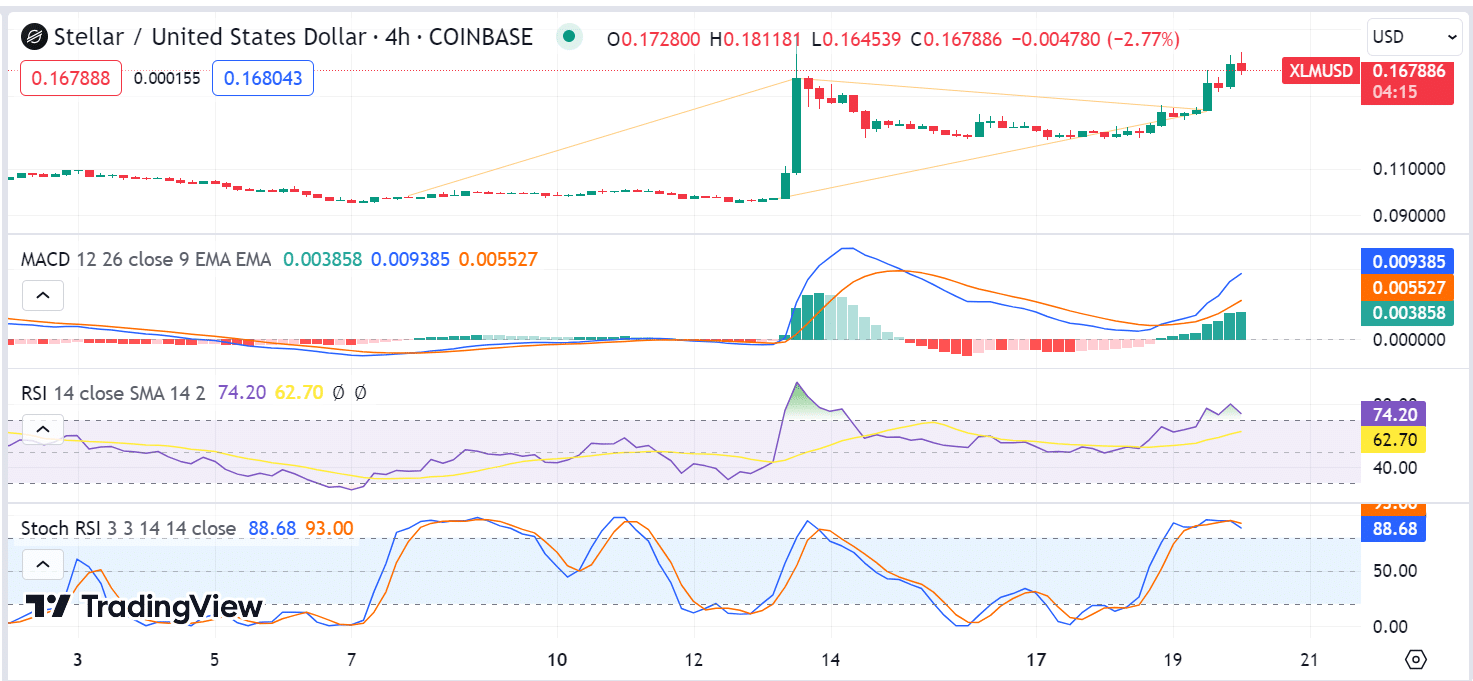
Stellar XLM Forms an ascending triangle as bulls target a breakout above $0.1793.
The Stellar XLM coin’s recent bullish action has seen the altcoin form higher highs at $0.165 and higher lows at $0.1574, creating an ascending triangle chart pattern. The pattern is usually a sign of bullish market sentiment, with the XLM price potentially breaking out above the $0.1793 resistance point in the next few days and continuing its uptrend.
On the downside, there is support at $0.1574, which could be tested if XLM fails to break out above the triangle in the short term. If so, a break below this level could lead to retesting of the $0.1358 support point, which is the lowest price level since June 27th.
If bulls can break out above the triangle and hold onto their gains, Stellar XLM could target higher levels, such as $0.20 or even higher. Stellar XLM is trading at $0.1681, up by over 20% in the last 24 hours.
XLM/USD Daily Chart Technical Analysis: XLM Rallies Near-term, Could Target $0.20
On the daily chart, Stellar XLM appears to form an ascending triangle as bulls target a breakout above $0.1793 in the coming days. The technical indicators also hint at more upside potential in the near term as the MACD and RSI look poised for further gains.
The real test for the XLM bulls will be a successful breakout above $0.1793 resistance, which could open up further gains to the upside and could potentially target levels of around $0.20 in the coming days. Bulls may have to retest lower support levels, such as $0.1574 or even $0.1358 if they fail to break out.
The technical indicators on the daily chart signal a bullish continuation in the near term, though a break below $0.1358 could change the short-term outlook for XLM significantly. Meanwhile, the EMA’s on the daily chart remains neutral, suggesting the XLM price trend could reverse if the profit-taking begins. In that scenario, the key retracement levels to watch out for are $0.1574 and $0.1358.
XLM 4-hour Chart Technical Analysis: Bulls Target a Breakout Above $0.1793
The 4-hour chart also shows an ascending triangle pattern, which suggests that bulls could break out and push the XLM price higher in the next few days. The MACD and RSI indicators suggest more upside potential in the near term, which could lead to a successful breakout above the $0.1793 resistance point.

If bulls fail to break out, Stellar’s XLM price could retest lower support levels, such as $0.1574 or even $0.1358, in the coming days. The key support levels to watch are $0.1574 and $0.1358, which could hold the key to further upside potential for XLM.
The Stochastic RSI is also trending higher, suggesting that bullish momentum could increase in the near term. The next few days will be crucial for the XLM bulls as they attempt to break out above $0.1793 and aim for levels of around $0.20 in the coming weeks.
Looking ahead, the key barrier to further gains for Stellar XLM lies at the $0.1793 resistance point, which is being tested by bulls in the short term. If they can break out and hold onto their gains, it could open up further upside potential to around $0.20 in the coming days. Strong support at $0.1574 and $0.1358 could contain any downside action in the near term.
 thecryptobasic.com