- 1 The Graph price is currently trading at $0.1218 while observing a gain of 2.87% during the intraday session.
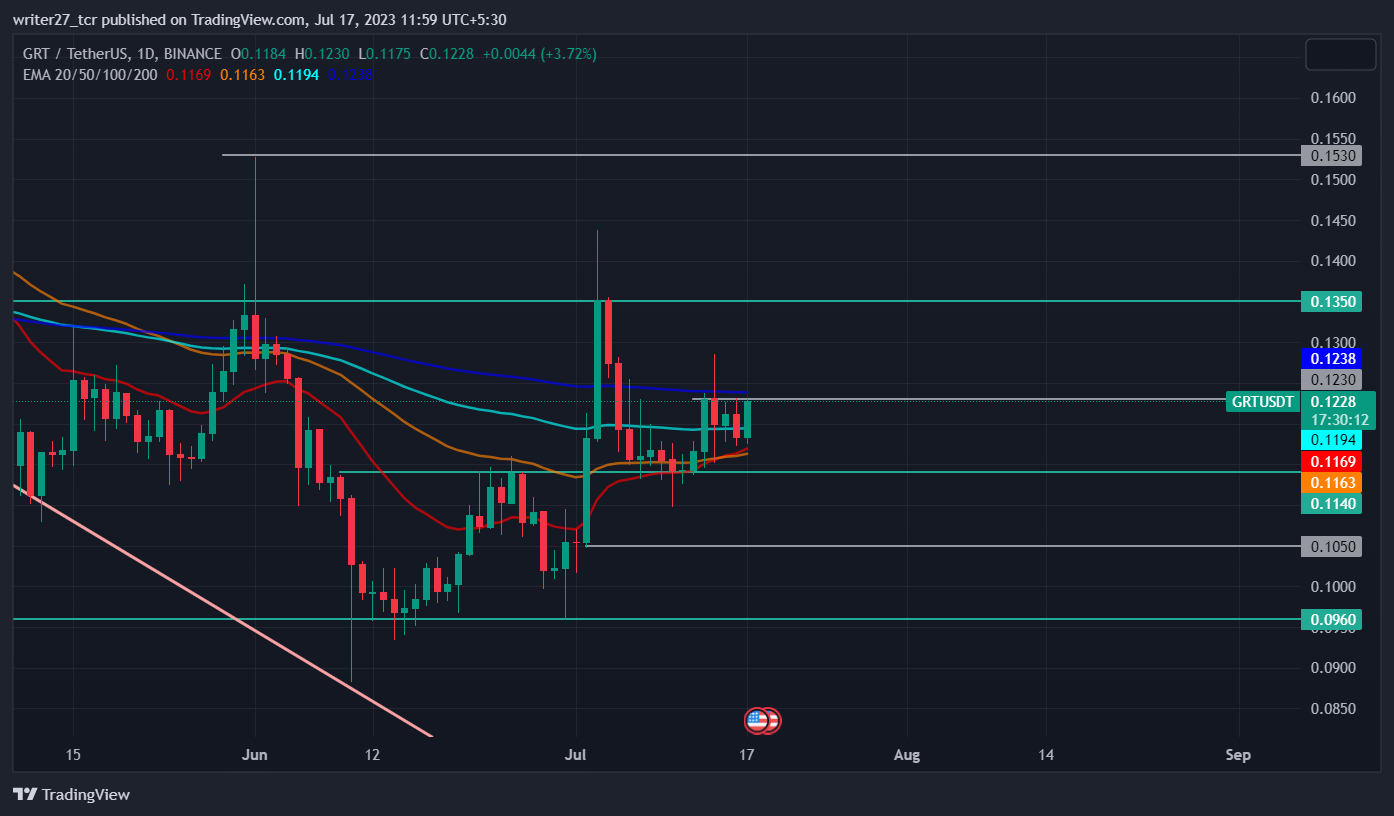
- 2 GRT price has positively crossed the 20,50 and 100-day EMAs but still trades below the 200-day EMA.
- 3 The year-to-date return of The Graph is 119.10% while the three-month return is -29.51%.
Since GRT price faced rejection from the $0.1740 level in April, it entered into a downward channel, thereby forming lower lows. During the start of June, the price successfully shattered the resistance level of $0.1350 but it faced strong resistance from $0.1530, leaving a long wick to the upside and closing below $0.1350, indicating strong presence of bears above the $0.14 level.
During the middle of June, The Graph price formed a support at $0.096 and started to rise. A positive sentiment was induced in the whole crypto market as BlackRock, one of the largest asset managers, filed for Bitcoin Spot ETF.
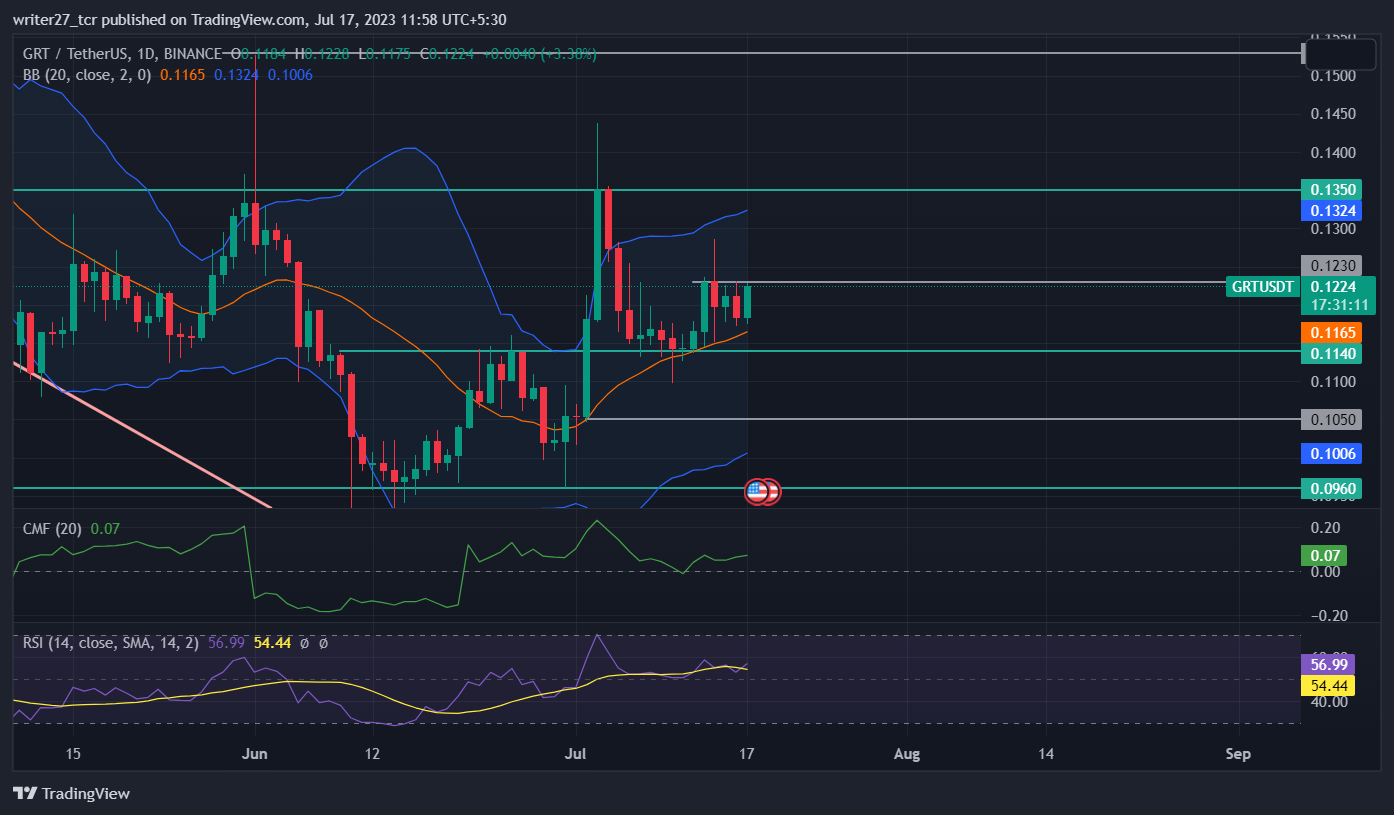
Recently, the cryptocurrency’s price rejected the $0.1350 level and retraced back to form a support at $0.1140. The price must surpass the $0.1230 level to retest the resistance level of $0.1350, which is the recent hurdle. If a candle can successfully break and close above $0.1230, there is a potential for a retest.

On the other hand, if bears are capable of pushing the price below $0.1140, it might head down toward the next support level of $0.1050, causing a loss of 7.77%. The market capitalization of The Graph has increased by 0.34% to $1,104,828,957. The 24-hour trading volume is down by 5.57%. The cryptocurrency’s price is down by 95.76% from the all-time high of $2.88.
Will GRT Price Rise Above $0.14 Level In July?

The cryptocurrency’s price trades above the 20,50 and 100-day EMAs, suggesting bullish momentum in the price. The 200-day EMA has been acting as a resistance and if price can shatter the support level of $0.1230, it could rise above the 200-day EMA. Chaikin money flow score is 0.07, indicating that there is strength in the market.
RSI trades at 56.09, denoting that price is still under the control of bulls. The 20-day SMA of bollinger has been acting as a support and the price is currently headed toward the upper band which resides near the major resistance level of $0.1350. The only minor hurdle in front of The Graph price is the $0.1230 level.
The long/short ratio is 0.99 with 49.92% longs and 50.08% shorts, suggesting a slightly higher selling position in the last 24 hours.
Conclusion
The market structure and price action of The Graph has turned bullish after it formed support at $0.1140. The technical parameters suggest that there is strength and the presence of bulls in the market. Risk-averse traders should wait for the candle to break and close above $0.1230 before looking for any bids.
Technical levels
Major support: $0.1140 and $0.1050
Major resistance: $0.1350 and $0.1530
Disclaimer
The views and opinions stated by the author, or any people named in this article, are for informational purposes only. They do not establish financial, investment, or other advice. Investing in or trading crypto assets comes with a risk of financial loss.
 thecoinrepublic.com
