- 1 OKB price stayed near the neutral range of $50 and held the gains.
- 2 OKB price analysis suggests an upcoming bullishness on the charts.
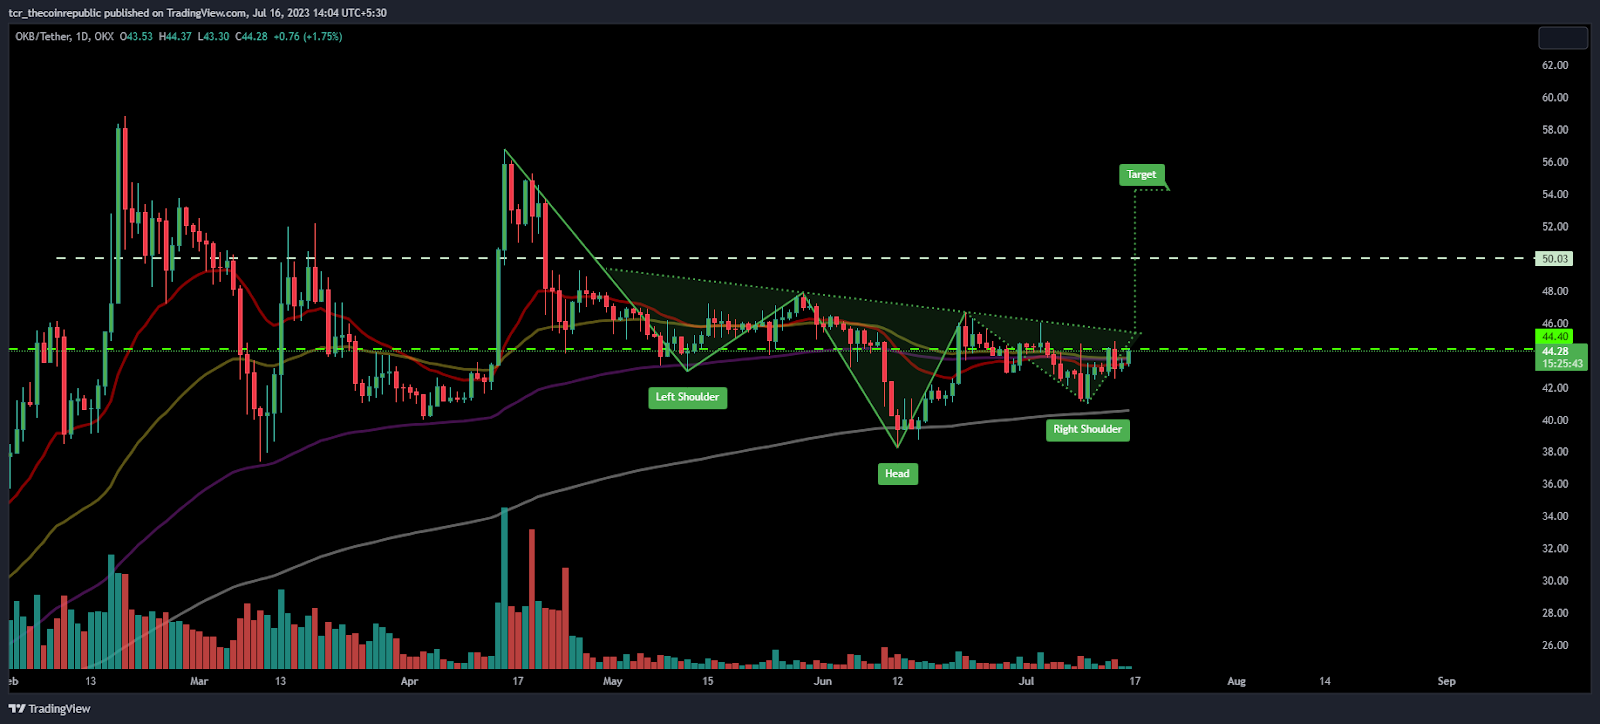
The price of OKB token is gradually entering the bullish range and is willing to catch $50 soon. Moreover, the price action rose in the following sessions, as bulls defended the 200-day EMA and bounced from there.
The token price is near the neckline of $46, which, if surpassed, would give rise to fresh momentum in price. Moreover, the chart shows an inverted head and shoulder pattern, which indicates a significant increase in the upcoming sessions.
The chart structure shows that the OKB token has spent much time between $30 – $45 in the narrow range, but does not scratch $50. This time, bulls look interested in surpassing the range, and also, a pattern has been established which suggests a rise in the near term.
In the past months, the OKB price stayed in a congestion zone and traded inside the cage, which dropped the token demand among investors. Recently, the price retested a strong support range and rebounded from the 200-day EMA. Afterward, buyers accumulated the token and rescued strength and are willing to catch $50.
At the time of writing, OKB price is trading at $44.28 with an intraday gain of 1.95%, showing bullishness on the charts. Moreover, the pair of OKB/BTC is at 0.00146 BTC. The market cap is $10.44 Billion. The 24 hrs trading volume is $2.69 Million.
Daily Charts Suggests Rise In Near Term

On the daily charts, OKB formed an inverted head and shoulder pattern whose neckline is near $46, which if crossed, will result in a massive breakout. Sellers stayed cautious and slowly covered their positions from the past sessions, resulting in a surge in the token price. However, the trading volume needs to be increased for a strong breakout.
As per the technicals, OKB price is trading above the Fib level of 23.6% and heading toward the round level of $50. Furthermore, the price is crossing the middle bollinger band and rising toward the upper bollinger band. Also, the converging moving average signals for a further range breakout.
What Technical Indicators Say?

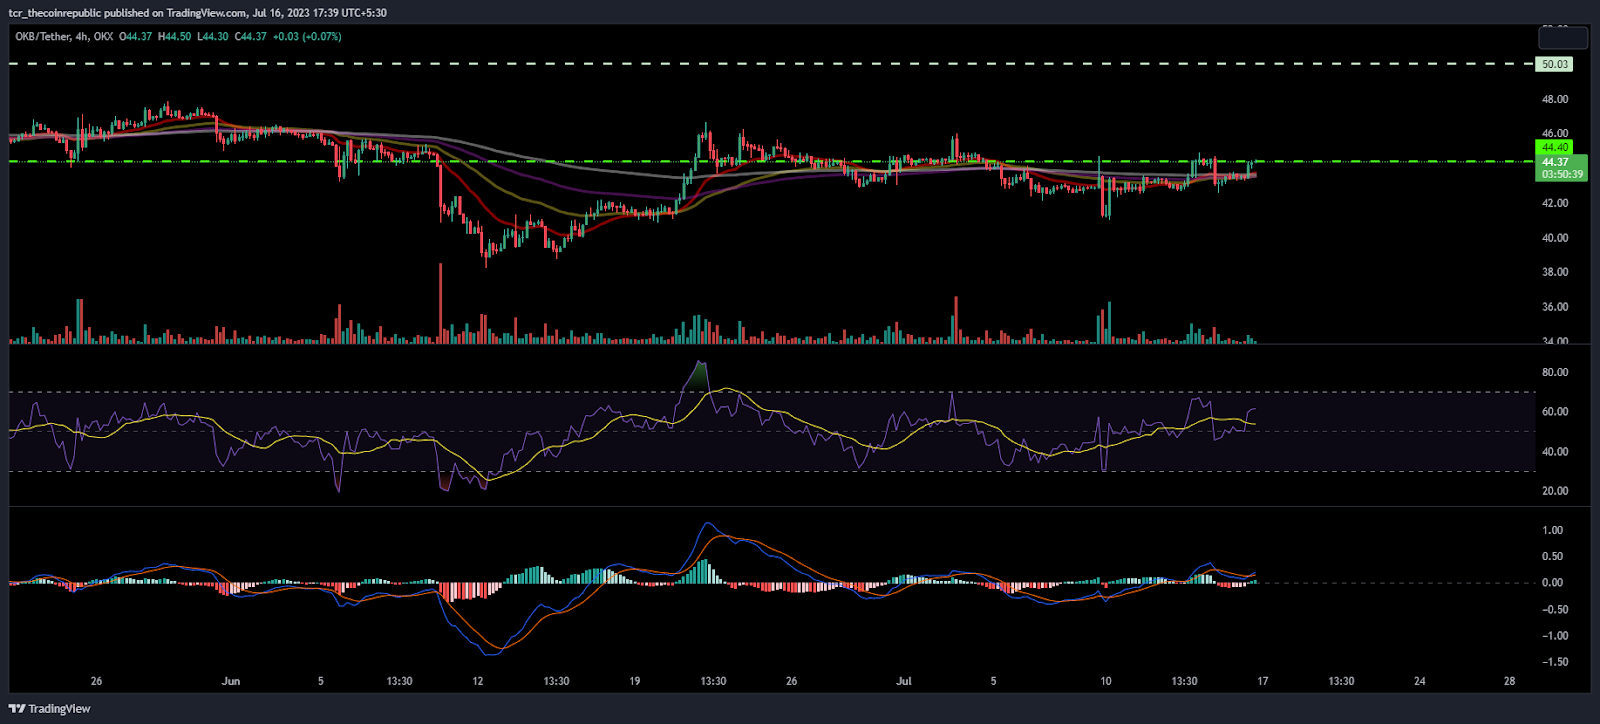
On the 4-hour charts, OKB price shows a rise in momentum near the neckline of $46, indicating that bulls are accumulating the token and are ready for a range breakout.
The RSI curve is near 60, forming a positive divergence on the charts favoring the bulls to extend the momentum.
The MACD indicator also initiates a bullish crossover and forms green bars showing signs of a positive outlook on the charts.
Conclusion:
OKB token price is leaving the range and is near the neckline of $46, which indicates that a range breakout is near.
Technical Levels:
Support Levels: $40
Resistance Levels:$53 and $60
Disclaimer
The views and opinions stated by the author, or any people named in this article, are for informational purposes only and do not establish financial, investment, or other advice. Investing in or trading crypto assets comes with a risk of financial loss.
 thecoinrepublic.com
