Stellar (XLM) has emerged as one of the top 5 altcoins in terms of price gains over the past week, benefiting from a broader crypto market rally. The surge in prices is largely driven by growing hopes of institutional adoption, as the cryptocurrency ecosystem continues to garner increased attention and interest.
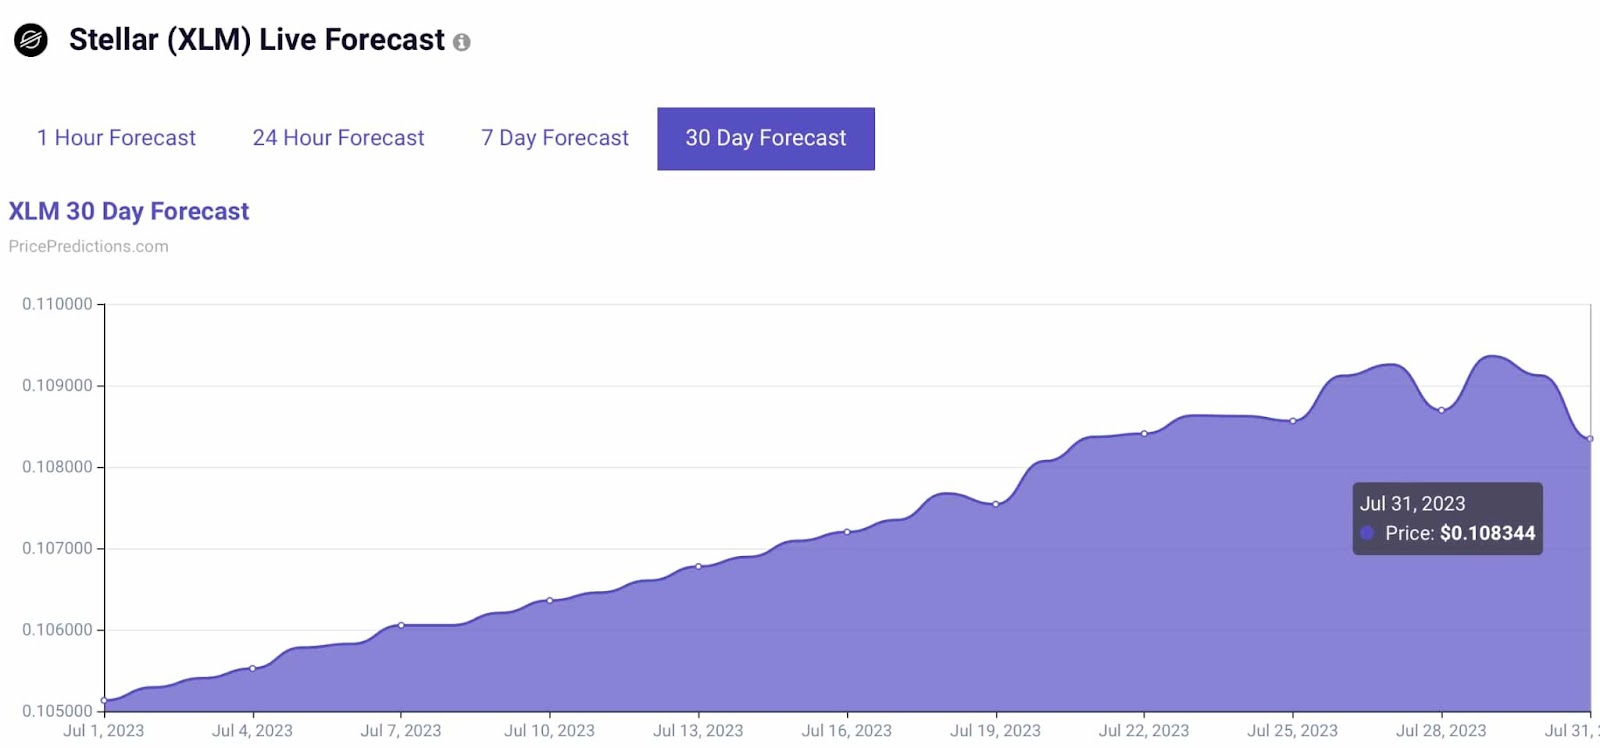
Seeking further insights into XLM’s potential near-term price movements, Finbold tapped the machine learning algorithms deployed by the crypto monitoring and prediction platform PricePredictions on June 30.
According to its projections, Stellar’s price is anticipated to stand at $0.1083 on July 31, suggesting a minor price change of 1.5% from its current price.

The above forecast is based on several key technical indicators, including the moving average convergence divergence (MACD), relative strength index (RSI), Bollinger Bands (BB), and more.
For comparison, on June 29, Finbold also asked Google Bard, Alphabet’s artificial intelligence (AI) bot, to offer a prediction on XLM price for the end of 2023. Notably, the chatbot’s average projection was $0.10, while low and high estimates stood at $0.08 and $0.12.
XLM price analysis
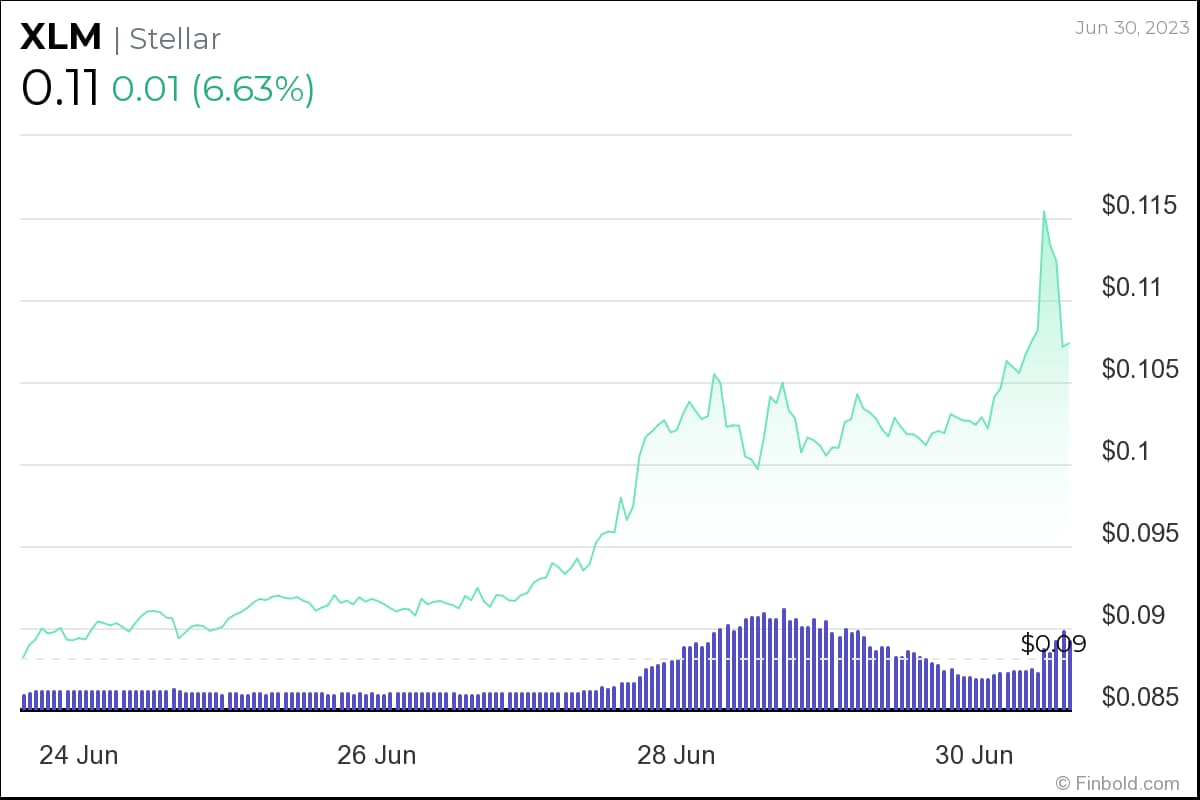
Stellar’s price at the time of writing stood at $0.11, up more than 6.6% in the past 24 hours. The cryptocurrency gained over 23% in the past week, adding more than $600 million in market cap during that period.
The surge was in part driven by Stellar’s announcement that Coinbase had integrated support for USD Coin (USDC) on its blockchain network. This major development now allows fast and cost-effective transactions across over 180 countries.

Year-to-date, XLM’s price surged by more than 57%.
Currently, Stellar (XLM) exhibits a support level of $0.0976, indicating a price point where buying pressure tends to outweigh selling pressure, potentially preventing further downward movement. On the other hand, the cryptocurrency faces a resistance level of $0.11403, representing a price threshold where selling pressure tends to outweigh buying pressure, potentially hindering further upward movement.
The token is also trading above its 200-day simple moving average (SMA) and has experienced 16 days in positive territory over the past month, or 53%.
Disclaimer: The content on this site should not be considered investment advice. Investing is speculative. When investing, your capital is at risk.
 finbold.com