- 1 Zilliqa price is currently trading at $0.02030 with a loss of -1.74% during the intraday session.
- 2 Zil price faced resistance from the 50-day EMA.
- 3 The 24-hour volume of Zilliqa is down by 51.28%.
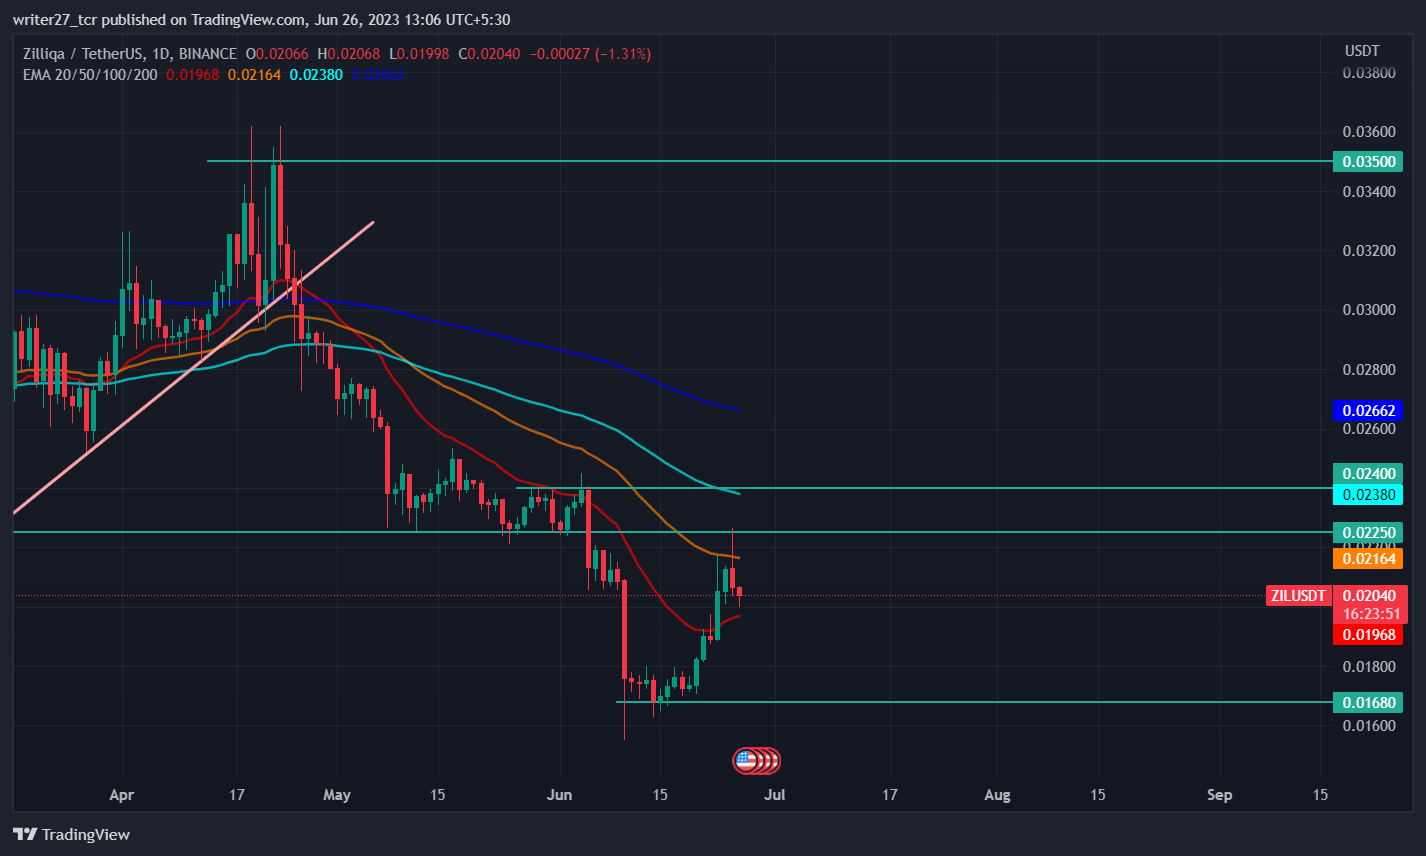
In march, Zil price commenced an uptrend from a low of $0.02250 , forming higher lows in order to retest the annual high of $0.03696. As price began to rise, it faced resistance from the $0.036 level, which triggered a drop in the price and it fell straight to the point from where the bullish rally started.
The cryptocurrency price then consolidated near the support level of $0.02250. During the start of June, Zil price finally gained enough bearish momentum to shatter the support level amid the SEC’s legal actions taken against crypto exchanges. It broke the support and fell to form a new support level at $0.01680.
The price has been bullish after the formation of the recent support level. The cryptocurrency market has been witnessing a bullish trend since last week as the price of Bitcoin and Ethereum surged. The previous candle closed in a bearish trend after facing resistance from the $0.02266 level and the current candle has broken the low of the previous candle.

The current candle is lingering between $0.02 and $0.021. If bearish pressure rises in the market and the Zil price falls below $0.02, there is a high probability for the price to reach the $0.019 level. If the price can break the upper wick of the previous candle, it might head toward the next major resistance level of $0.024.
The year-to-date change of Zil Price is 28.24% while the three-month return is -21.80%. The market capitalization of Zilliqa is down by 4.88% to $325 million.
Will Zil Price Recover From June’s Losses?

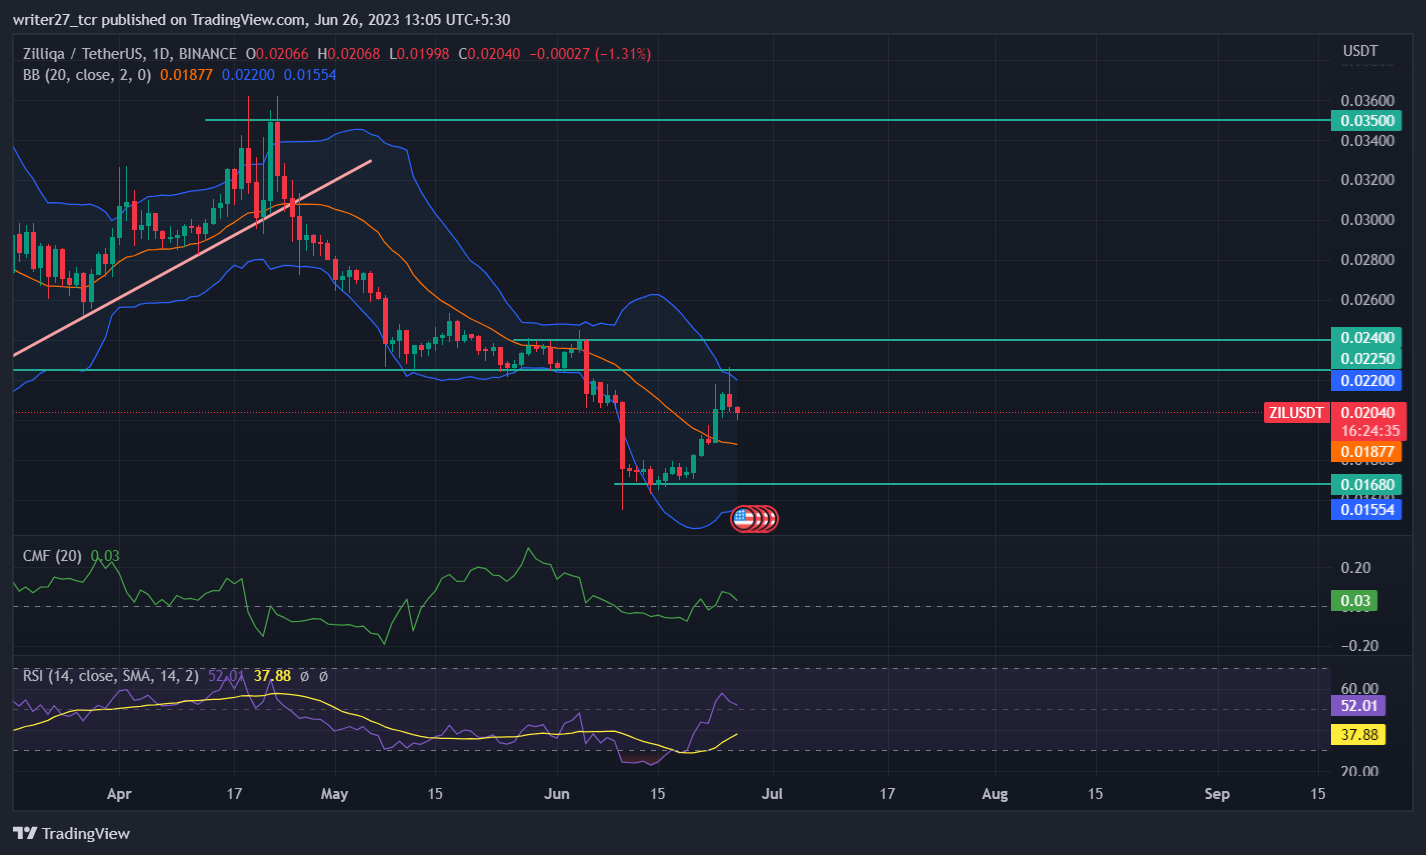
Zil Price has crossed above the 20-day EMA and is facing resistance from the 50-day EMA. Overall, the price is in a bullish trend since the past week and the rise above the 20-day EMA also suggests that this is the case. The Chaikin money flow(CMF) score is 0.03, which denotes strength in the market. CMF began to rise from -0.08. Relative strength index RSI) has crossed above 50 and is currently trading at 52.38, but RSI has started to dip as the price turned bearish.
Zilliqa price reached the upper band of bollinger and has started to witness selling pressure. There is a possibility that Zil price might fall to the 20-day SMA of Bollinger for forming a support before rising further. The long/short ratio of Zilliqa is 0.82 with 47.11% longs and 52.89% shorts, indicating increased participation of sellers in the last 24 hours.
Conclusion
The market structure and price action of Zilliqa is bullish but the current and previous candle have shown presence of bears at the current level. The technical indicators are currently favoring the selling side. There is a possibility of a short-term pullback toward the $0.019 level for the price to form support and then move higher.
Technical levels
Major support: $0.0168 and $0.016
Major resistance: $0.0225 and $0.024
Disclaimer
The views and opinions stated by the author, or any people named in this article, are for informational purposes only. They do not establish financial, investment, or other advice. Investing in or trading crypto assets comes with a risk of financial loss.
 thecoinrepublic.com
