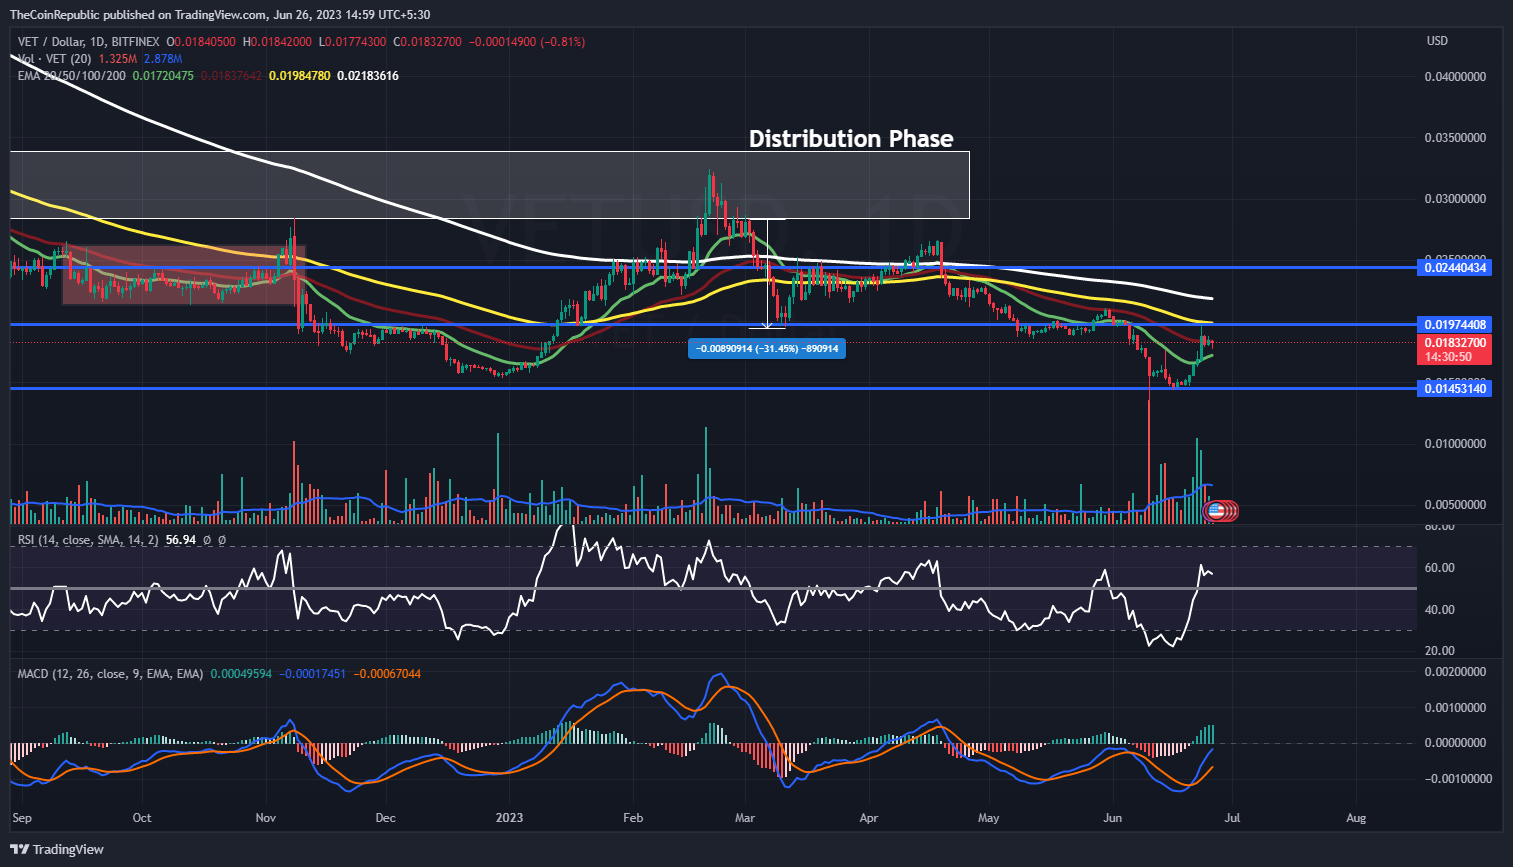
- 1 Vechain price prediction suggests the token’s sustainability issues at the current level; over the daily time frame chart.
- 2 VET crypto is trying to sustain above 20 and 50-EMA to surge towards 100 and 200-day Daily Moving Averages.
- 3 The pair of VET/BTC was at 0.0000005978 BTC with an intraday drop of 1.59%.
Vechain price prediction showcases the sustainability issues of VET cryptocurrency to surge towards the primary resistance level. VET crypto needs to sustain and surge to recover over the daily time frame chart. However, buyers need to come forward to save VET crypto from falling toward the lower support zone.
Vechain price was at $0.018296 and lost 0.97% of its market capitalization during the day’s trading session. Trading volume decreased by 3.45% during the intraday trading session. This demonstrates that sellers are trying to pull the VET crypto over the daily time frame chart. The volume-to-market cap ratio was at 0.0303.
What do Technical Indicators Suggest About VET Crypto?
 VET Crypto!">
Vechain price prediction indicates the downtrend momentum of VET cryptocurrency over the daily time frame chart. However, VET crypto has been trying to sustain the current surge. VET has gained around 23.07% in a week and 14.24% in a month. Moreover, Vechain price has soared around 15.70% year-to-date suggesting the maximum recovery of VET crypto during 2023.
Technical indicators suggest the sustainability issues of VET crypto over the daily time frame chart. The relative strength index showcases the downtrend momentum of Vechain crypto price. RSI was at 57 and is trying to maintain above neutrality.
MACD exhibits the upward velocity of Vechain price. The MACD line is above the signal line after a positive crossover. Investors in VET cryptocurrency need to for any directional change over the daily time frame chart.
Summary
Vechain price prediction showcases the sustainability issues of VET cryptocurrency to surge towards the primary resistance level. Vechain price prediction indicates the downtrend momentum of VET cryptocurrency over the daily time frame chart. Moreover, Vechain price has soared around 15.70% year-to-date suggesting the maximum recovery of VET crypto during 2023. Technical indicators suggest the sustainability issues of VET crypto over the daily time frame chart. Investors in VET cryptocurrency need to for any directional change over the daily time frame chart.
Technical Levels
- Resistance Levels: $0.0197 and $0.0210
- Support Levels: $0.1698 and $0.0155
Disclaimer
The views and opinions stated by the author, or any people named in this article, are for informational purposes only, and they do not establish financial, investment, or other advice. Investing in or trading crypto or stock comes with a risk of financial loss.
 thecoinrepublic.com
