- 1 Vechain price is currently trading at $0.01513 while witnessing a gain of 2.93% during the intraday session.
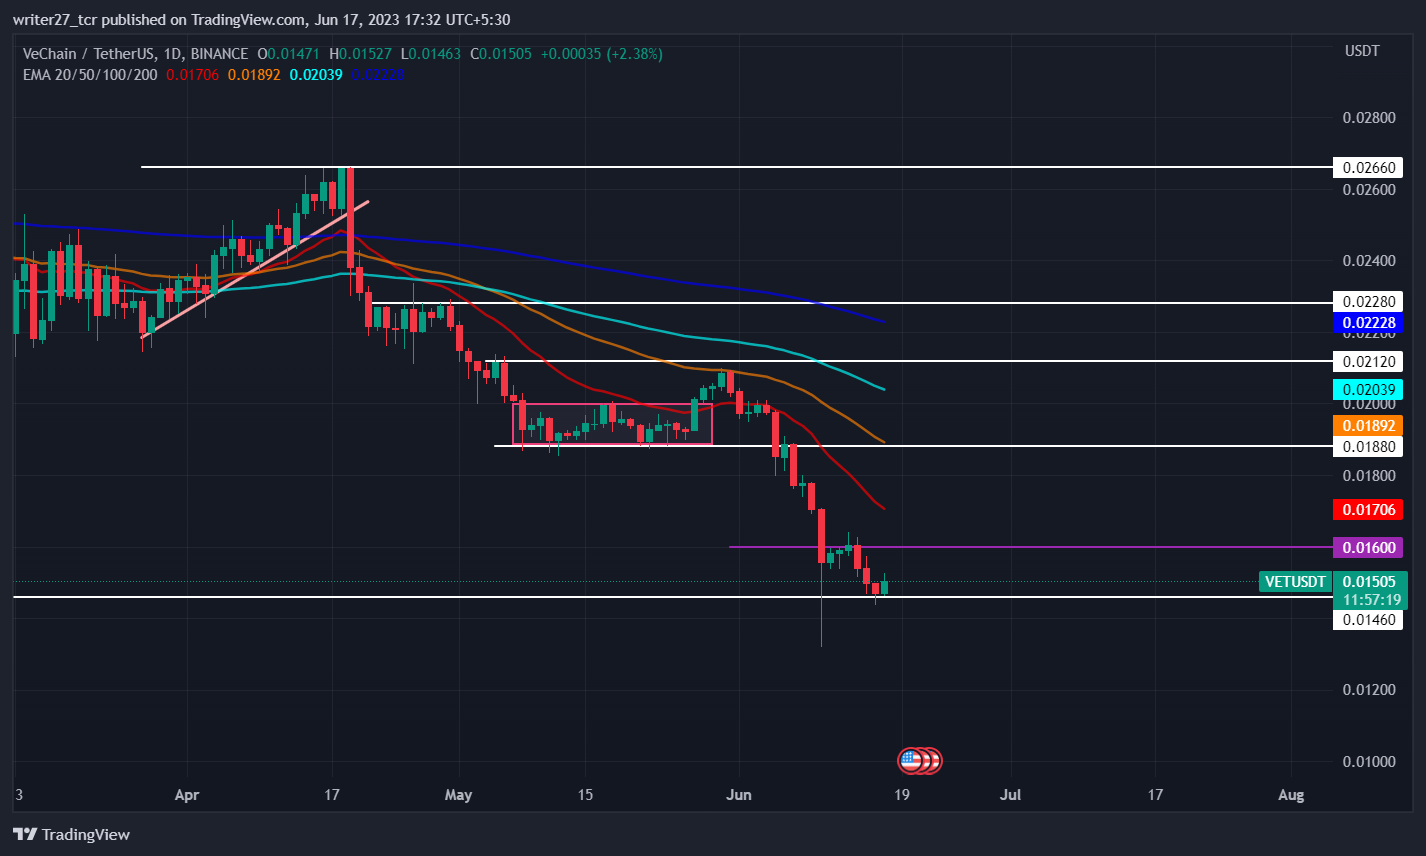
- 2 Vet price trades way below 20,50,100 and 200-day EMAs.
- 3 The year to date return of Vechain is -4.37%,
Vechain, a blockchain platform that seeks to incentivize a network of computers to operate a platform allowing businesses to build and run on decentralized applications (dapps).
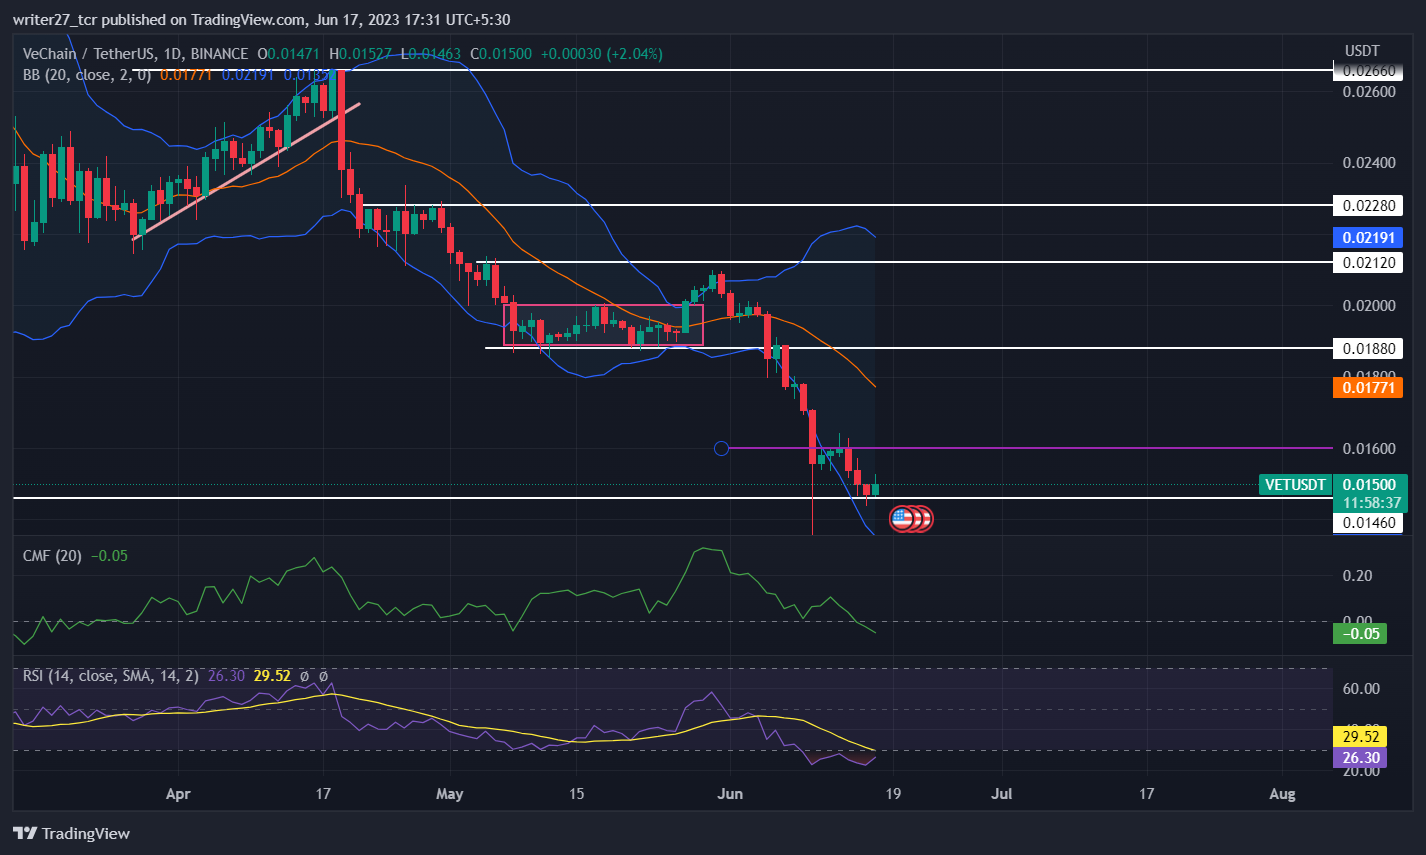
Vechain price seems to be gaining bearish momentum after breaking the yearly low and major support $0.0156 level. Vechain price was stuck in a consolidation zone since the starting of May ranging between $0.0188 and $0.0212.
During the start of June, Vet price gained enough bearish momentum to wreck the support of $0.0188 and yearly lows to melt down toward $0.013 level. The current candle is trying to form support at $0.01460 level and if that happens price might witness a pullback if bulls hold price above the support level.

Vet price is currently headed toward $0.016 level. If bulls can push price above $0.016, there is a high probability for the price to head toward the next resistance level of $0.0188 level. On the other hand, if bears can push the price below the low of the current candle, there is a possibility for the price to fill the low wick of the June 10 candle.
Recent Developments in Vechain
Recently, Vechain has partnered with Boston consulting group (BCG) in order to engage a billion users with a sustainable “blockchain Biosphere”. This initiative seeks to construct a cross industry ecosystem that harnesses data to spawn new forms of value.
Vechain has also partnered with Frac, a leading pioneer in high value fractional asset trading space, to improve the platform’s security and provide unalterable proof of authenticity. The initiate will also provide unchangeable authentication through the use of Near Field Communication (NFC) chips.
Will Vet Price Rise $0.16 Level?

Vet price trades below all the major EMAs indicating bearish momentum in the price. The chaikin money flow score is -0.04 suggesting weakness in the market. RSI has entered into the oversold zone suggesting a chance of reversal or short term pullback in the price.
RSI is currently trading at 27.52. This also indicates that the current candle might close bullish and form a support at $0.0146 level and rise toward the next support turned resistance of $0.0188. Vet price has already reached the lower band of bollinger which also indicates a possibility of pullback if bearish momentum slows down.
The long/short ratio is 1.13 with 53.19% longs and 46.81% shorts indicating increased participation of buyers in the last 24 hours.
Conclusion
The overall market structure and price action of Vet price is bearish and the current candle is trying to form a support. The technical parameters suggest chances of pullback in upcoming days. Traders should wait for the price to form a strong support.
Technical levels
Major support: $0.014
Major resistance: $0.016 and $0.0188
Disclaimer
The views and opinions stated by the author, or any people named in this article, are for informational purposes only. They do not establish financial, investment, or other advice. Investing in or trading crypto assets comes with a risk of financial loss.
 thecoinrepublic.com