- 1 Quant price is currently trading at $110.6 while witnessing a decrease of -1.52% during the intraday session.
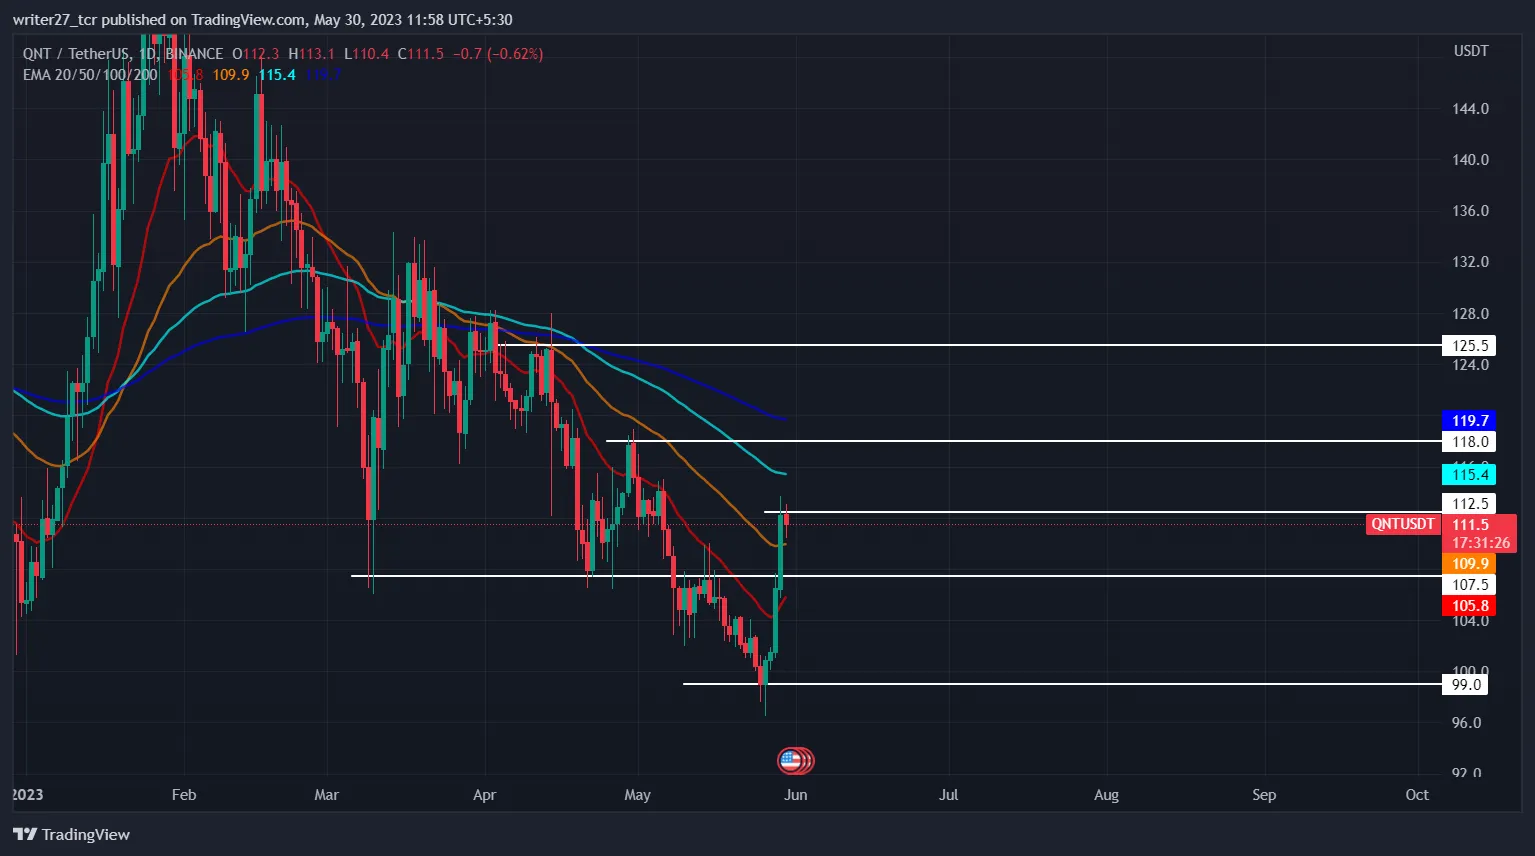
- 2 QNT price has positively crossed 20 and 50-Day EMAs.
- 3 The year-to-date change in QNT price is 4.94%, while the three-month change is -12.58%.
The bullish rally for Quant price began at the start of 2023 when the price started to rise from the low of $104.5, forming an annual high at $165. The rally caused an increase of 58% in a month. Quant price then began correcting its course. Bears entered the market and pushed the price down to form a support at the $107.5 level.
The support level helped the price rise, but bulls could not push the price above $135. On May 8, QNT’s price finally gained enough bearish momentum to shatter the support level of $107.5. The move made Quant lose all its 2023 gains, and the price did break below yearly lows.

Recently, QNT’s price formed support at the $99 level after breaking the crucial support level of $107.5. As Bitcoin rallied toward the $28,000 level, all the Altcoin also saw a price increase. Quant gained popularity through Quant Overledger, a multichain interoperability platform.
Reasons For Quant Price Rise
Anyone who wants to use Quant ledger must hold QNT tokens to access the platform resource, which resulted in massive demand for QNT and price rising from $42 to $230 in 2022 while other altcoins suffered losses.
If the QNT price can rise above the upper wick of the previous candle, it may head toward the $118 level. The current candle is bearish as the BTC price has also taken a downturn. Quant has also confirmed its involvement in the Rosalind project, a CBDC project organized by the Bank of England and the Bank of international settlement, the latter being linked to 63 countries.
Will QNT Price Reach $118 level?

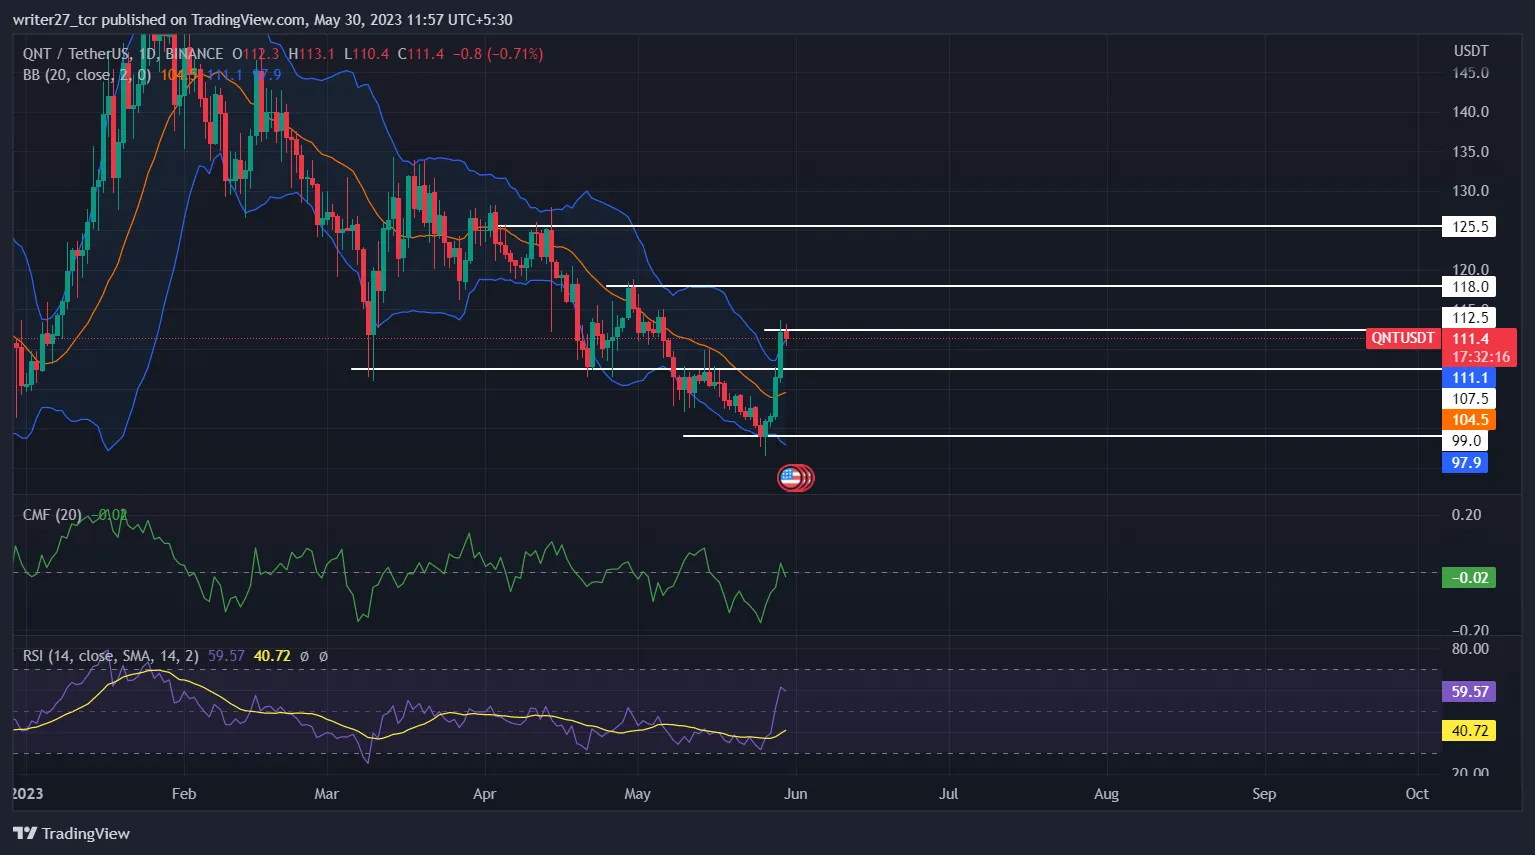
Chaikin money flow score is -0.02, indicating that weakness has started to rise in the market. CMF did rise above the 0 mark on 28 May, but as the current candle has turned bearish, it has dropped below the 0 mark. The RSI trades at 58.92, indicating bullish momentum in the price, and if the bullish rally continues, it will rise further toward the overbought zone.
QNT price has reached above the upper band of the Bollinger, indicating that the price might witness a pullback to the $107.5 level before rising further. The long/short ratio is 0.92, with 48% longs and 52% shorts, suggesting that bearish sentiment rises after the impulsive bullish move.
Conclusion
The market structure and price action for Quant price are bullish, but the impulse move is always seen to be corrected by the bears. The technical indicator provides mixed signals. The QNT price could drop toward the $107.5 level and form support before rising further. The $112.5 will act as resistance if the price drops.
Technical Levels
Major support: $107.5 and $99
Major resistance: $118 and $125.5
Disclaimer
The views and opinions stated by the author, or any people named in this article, are for informational purposes only. They do not establish financial, investment, or other advice. Investing in or trading crypto assets comes with a risk of financial loss.
 thecoinrepublic.com
