- 1 ICP token show bullish moves in the last session.
- 2 Bulls show their muscles giving breakout on charts.
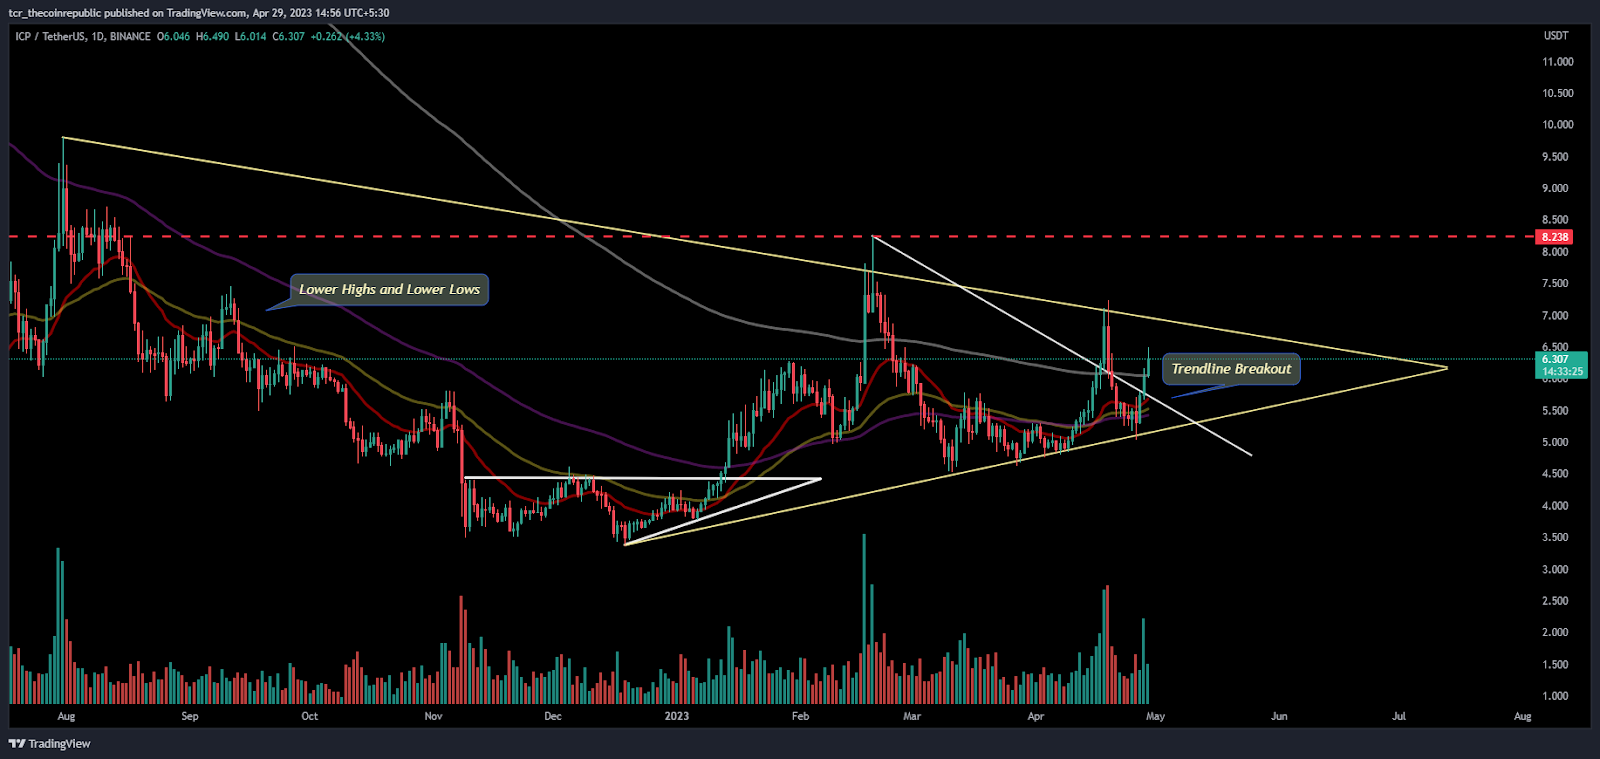
Internet Computer (ICP) token gives bullish cues on the daily chart showing a breakout above 200-day EMA. ICP is breaking its trendline and gaining momentum, and buyers are setting eyes on its immediate hurdle of $8.000.
Moreover, the token is trading above significant moving averages and favoring bulls. The sellers are trapped now and closing their short positions resulting in price short-covering moves. The strong resistance, the immediate hurdle of $6.00, was decisively broken in the last session. This range breakout by bulls gives a strong conviction that the token is ready to register a rally in price and try to fetch more highs.
When writing, the ICP token trades at $6.30 with an intraday gain of 6%. Moreover, the trading volume also increased by 31%, showing the interest of investors. The pair of ICP/BTC is at $0.0002153 satoshis, and ICP/ETH is $0.003317.
ICP Daily Chart Shows Bulls Rulage

On the daily chart, the ICP token trades above its congestion zone, and the upside trajectory is yet to hit. However, bulls are gaining traction from the last sessions. Moreover, the symmetrical triangle pattern upper neckline is yet to break; if the price cracks the range above $7.00, momentum will rise, and the token will retest its recent highs of $8.000. Moreover, the chart showcases rounding bottom formation and gradually uplifting gains. There is a firm conviction to arise from the chart based on price action to smash the immediate resistance of $7.00.
Furthermore, there is a strong breakout; bulls rule the uptrend, and sellers are trapped. The buyers continued to form long positions and break every hurdle, which led to token trade above 200 days EMA. The Fib levels indicate that the price is above 50% and ongoing momentum is very sharp, led by bulls.
What Traditional Indicator Says?

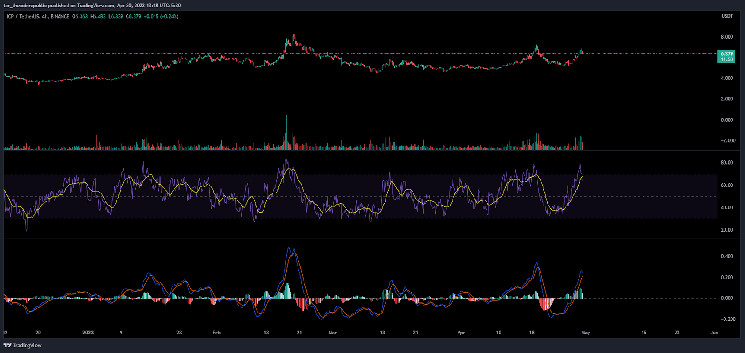
On the 4-hour charts, the ICP token maintains strength above its 200-day EMA and continues to lift the gains. Moreover, the RSI forms a positive crossover and rides above neutrality. The curve is near 60, in the overbought zone, and retracing towards 50. However, price action shows the buyers built up heavy traction, and more upside will be retested.
The MACD indicator plotted green bars on a histogram and indicated positive signals based on a recent bullish crossover.
Conclusion:
Internet Computer (ICP) price indicates bullishness on the charts as the recent breakout gave strong momentum to bulls. Furthermore, the price stayed above 200 days EMA, which is a strong sign of an uptrend.
Technical Levels:
Support Levels:$5.00
Resistance Levels: $7.00
Disclaimer
The views and opinions stated by the author, or any people named in this article, are for informational purposes only and do not establish financial, investment, or other advice. Investing in or trading crypto assets comes with a risk of financial loss.
 thecoinrepublic.com