The Cosmos (ATOM) price has broken out from a diagonal resistance level and could be in the initial stages of a larger upward movement.
The ATOM price has increased since April 12 and finally broke out from a more than two-month resistance line. It is now trading in the upper portion of its short-term pattern. Is there more momentum to come for ATOM?
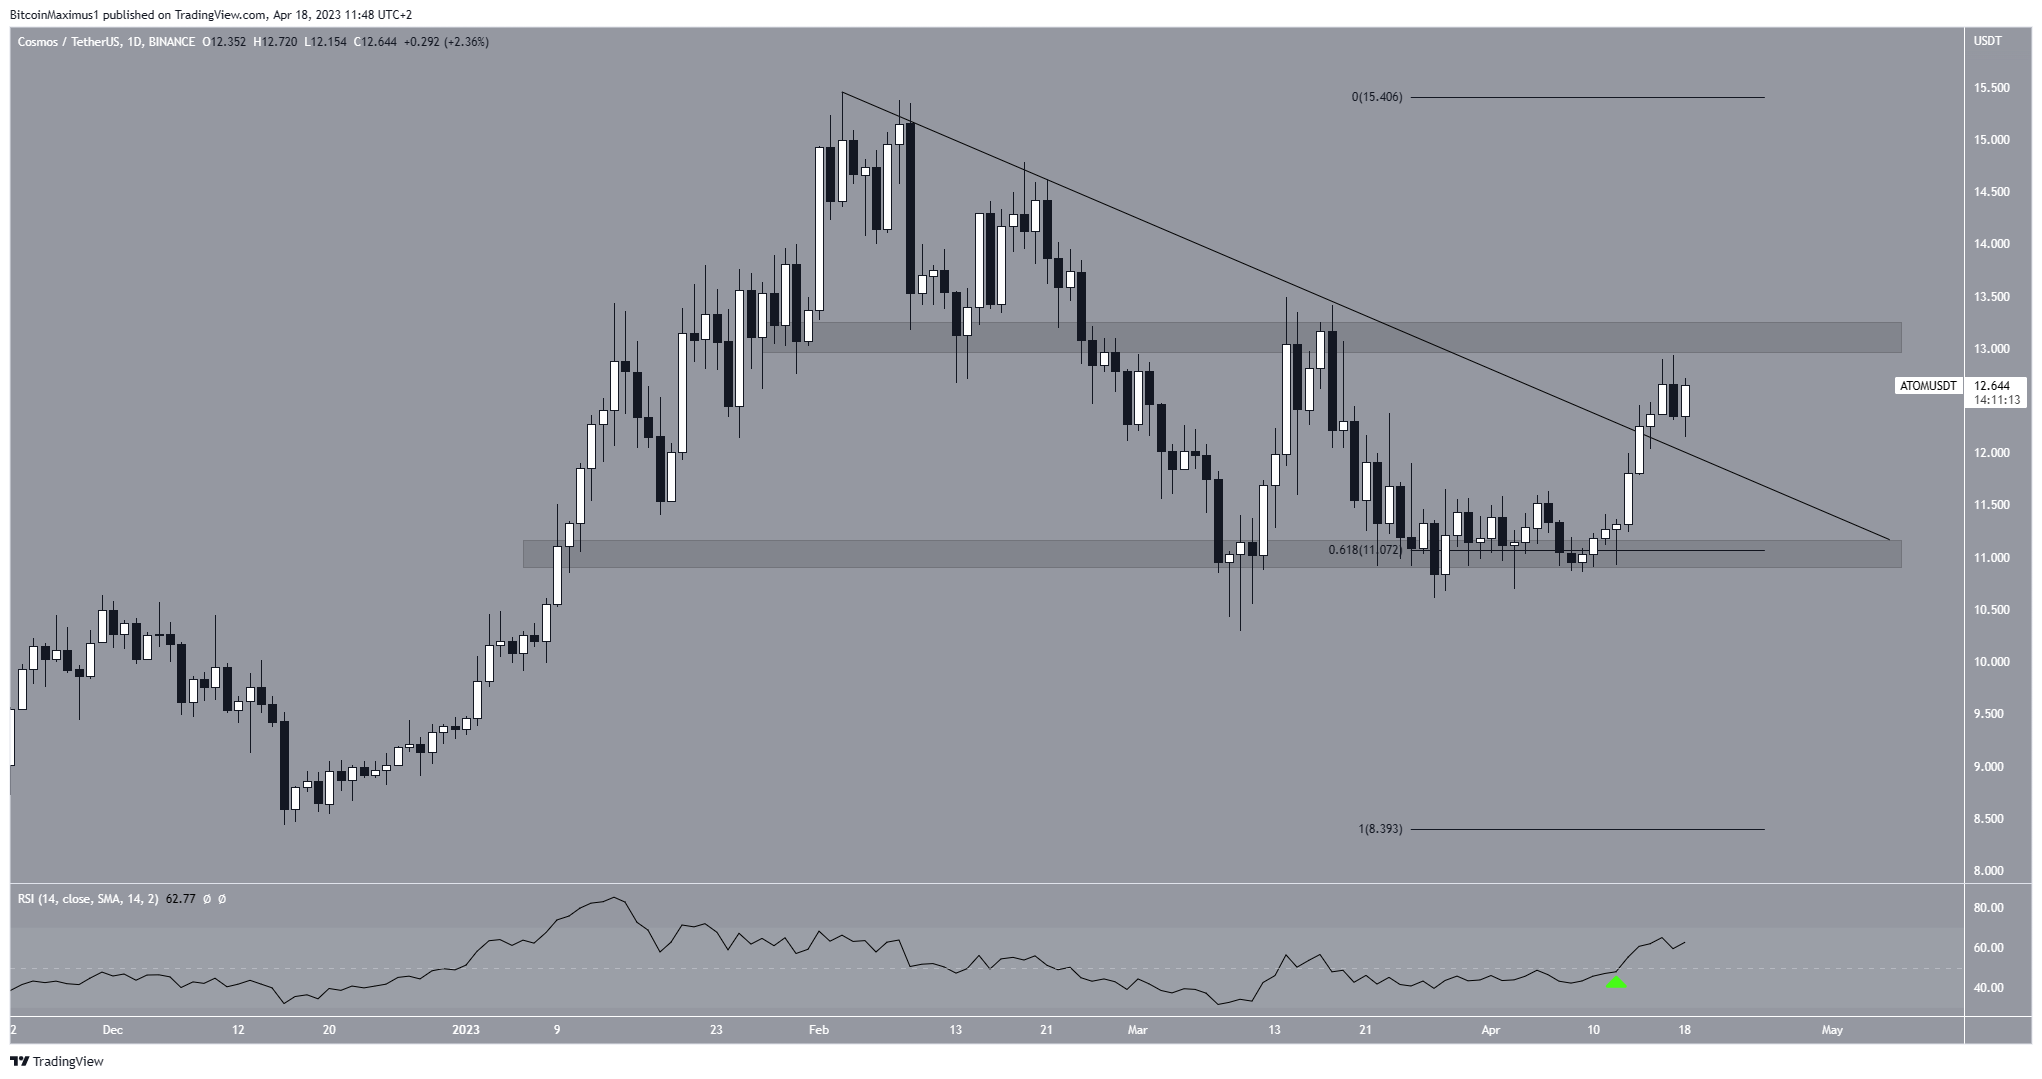
The ATOM price has fallen under a descending resistance line since Feb. 8. While doing so, it bounced numerous times at the confluence of support levels at $11.07. The support is created by both a horizontal support area and the 0.618 Fib retracement support level.
Fibonacci retracement levels operate as a set of horizontal lines derived from the Fibonacci sequence, which indicate areas where support and resistance may be encountered. Combined with the horizontal support area, this greatly increases the importance of the level.
After the final bounce on April 12, ATOM broke out from the line three days later. Breakouts from such structures usually indicate that the correction is complete.
Key Indicators Flash Bullish
Furthermore, the daily Relative Strength Index (RSI) moved above 50 (green icon). The RSI is a tool that helps traders understand if an asset is overvalued or undervalued by measuring how quickly its price changes. It measures momentum, and movements above 50 are a sign that buyers are in control.
Furthermore, the RSI looks at how fast and how big the price has moved recently to determine if it might be time to buy or sell the asset.

As a result, the readings from the daily time frame are bullish. The closest resistance area is at an average price of $13.20, and a breakout above it could take ATOM higher.
ATOM Price Prediction: $14 in Sight
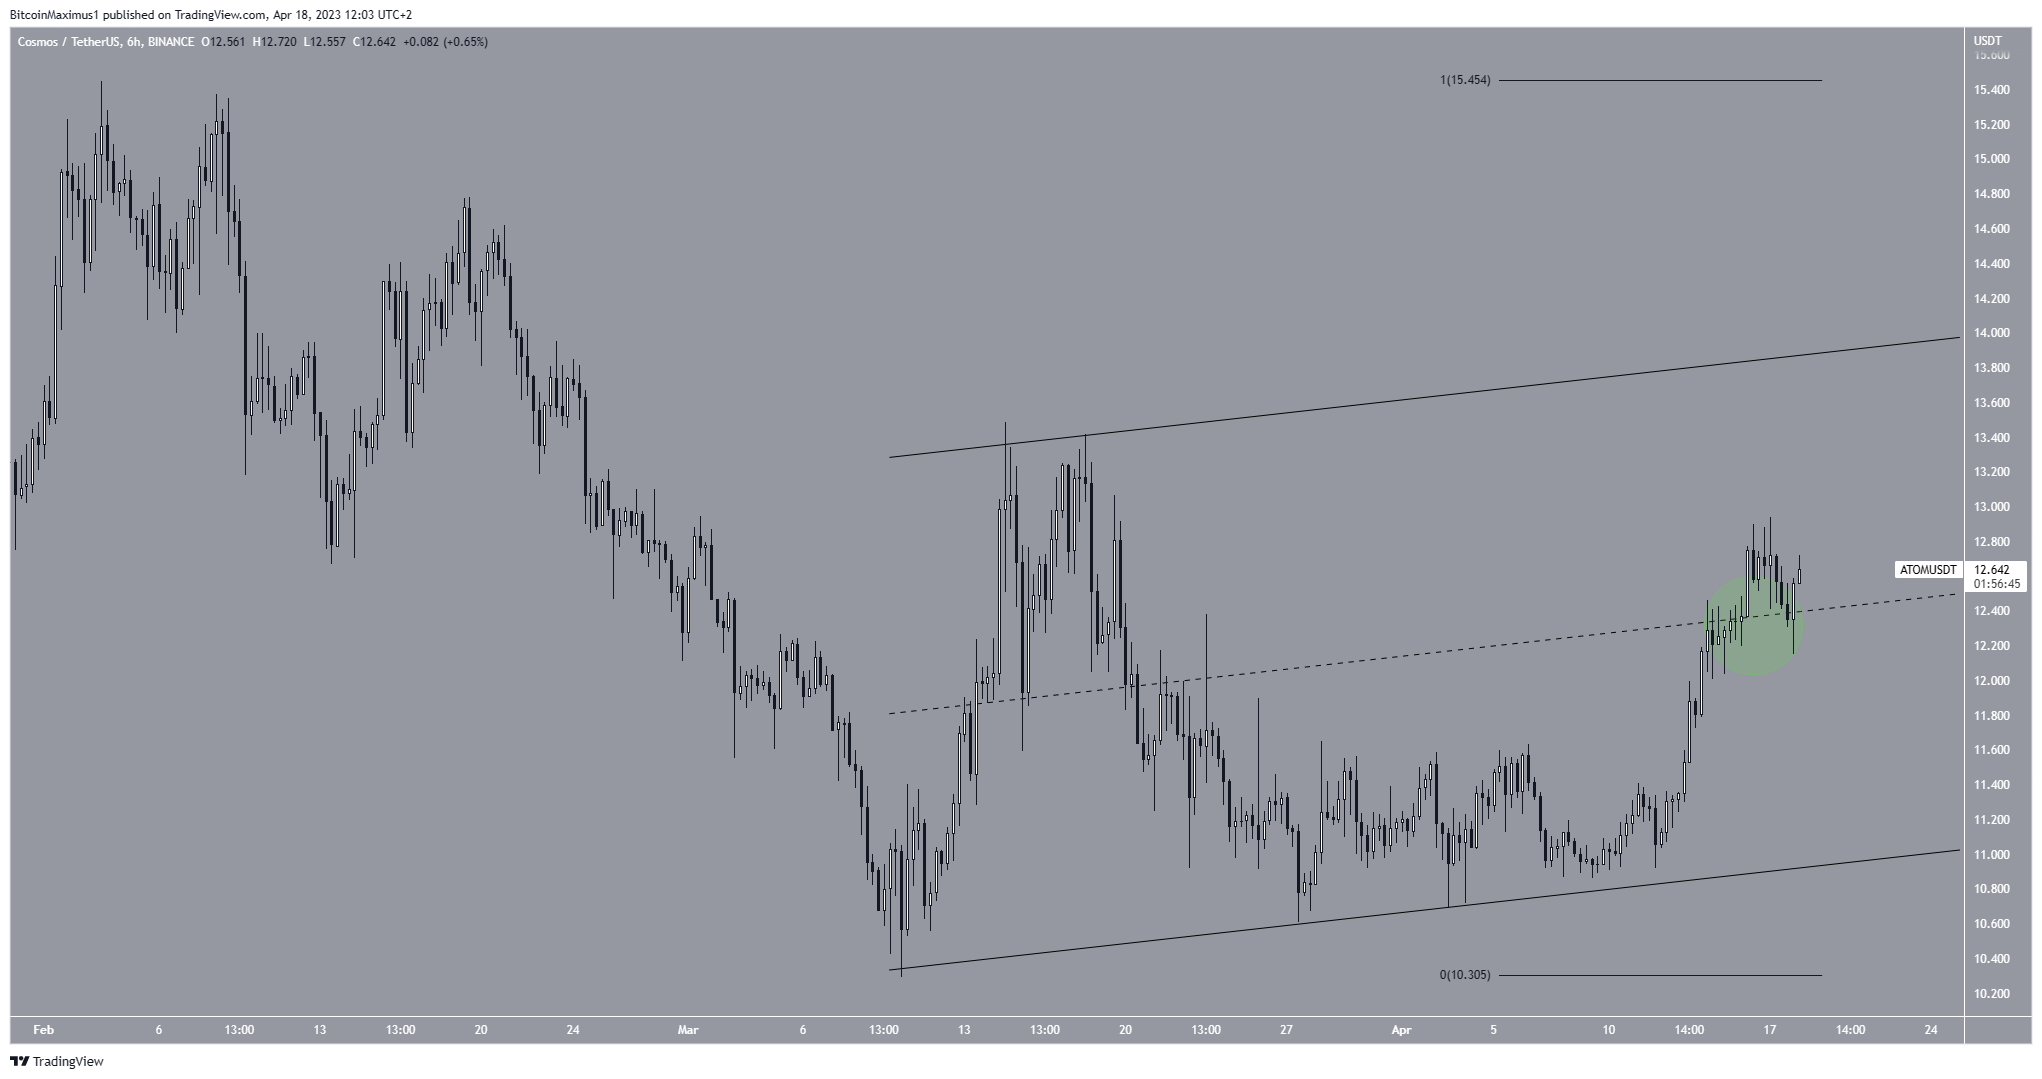
The short-term six-hour technical analysis supports the possibility that the ATOM price will break out from the $13.20 resistance area.
The main reason for this is that the price has moved above the middle of an ascending parallel channel over the past 24 hours. The ascending parallel channel is a corrective pattern, which indicates that an eventual breakdown from it is likely to occur.
However, the resistance line is expected to be touched numerous times. Since the price moved above its midline (green circle) and an increase toward the resistance line at $14 is expected.
Afterward, whether the ATOM token breaks out or gets rejected will likely determine the future trend. A breakout could take the price to $15, while a rejection would likely cause a drop to the channel’s support line at $11 and possibly cause a breakdown.

To conclude, the most likely ATOM price prediction is an increase toward $14. A decrease below the current channel’s midline would invalidate this bullish Cosmos price forecast. In that case, a drop to $11.20 could be the possible outcome.
For BeInCrypto’s latest crypto market analysis, click here.
 beincrypto.com