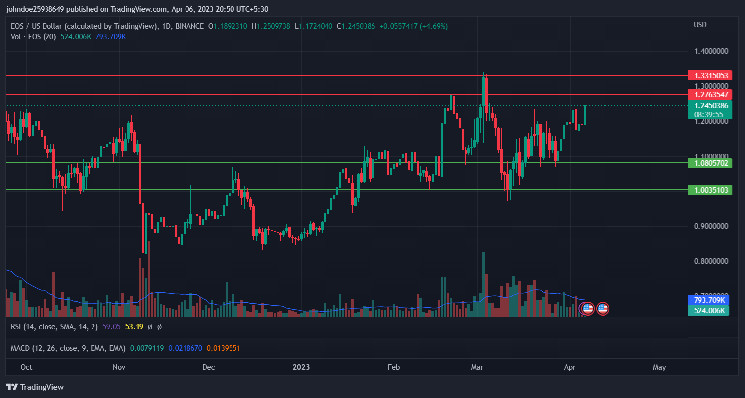
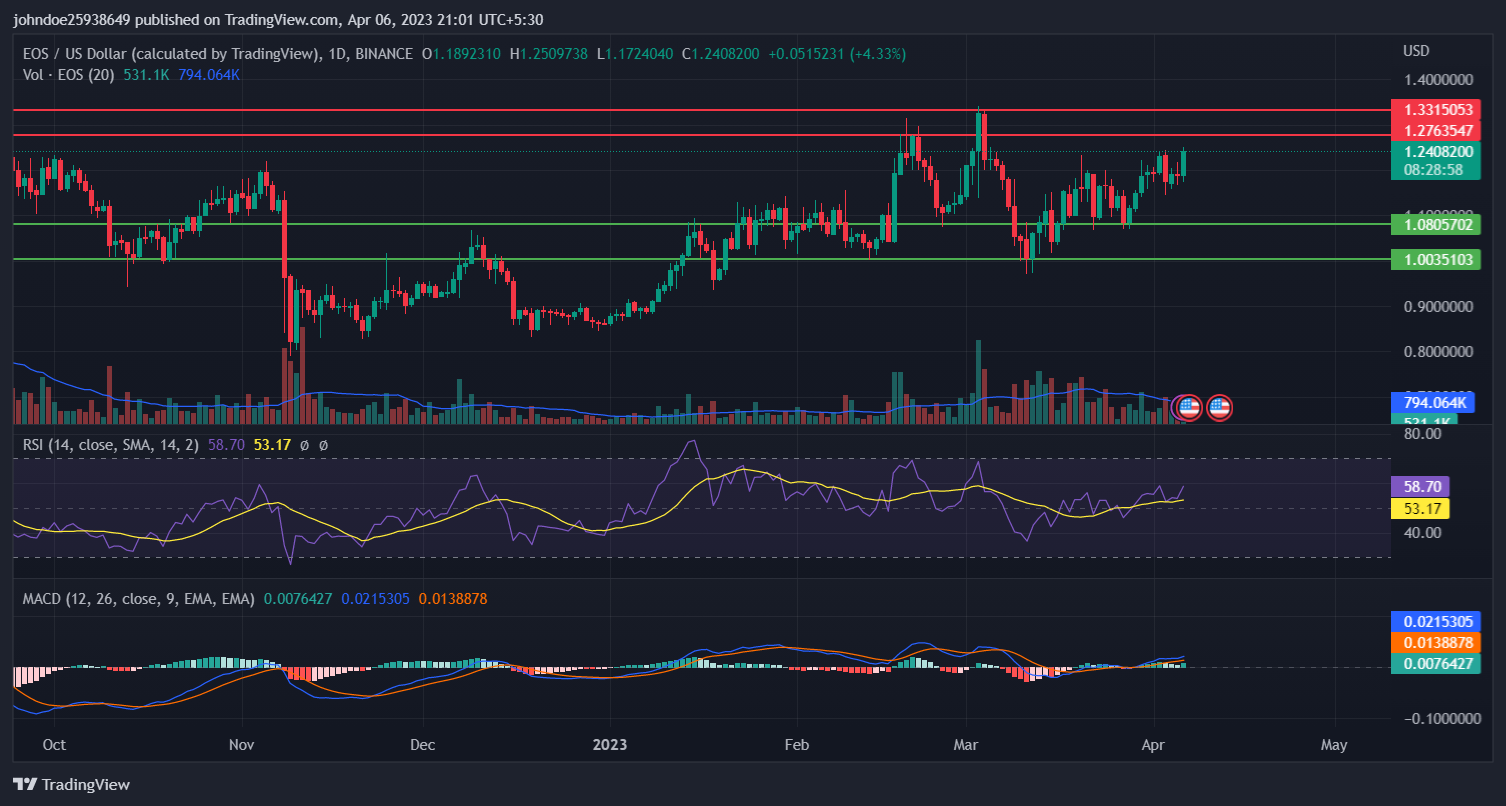
- 1 Eos’s price currently trades around $1.24 and has increased by about 5.41% during the intraday trading period.
- 2 The EOS/BTC exchange rate is currently 0.00004415BTC and has grown by 5.00% over the past 24 hours.
- 3 The EOS price lags behind the 20, 50, 100, and 200 days Daily Moving Average.
The EOS has begun to follow the upward curve. It indicates that the price of coins is moving in the direction of the bull’s goal area. The bears have become weaker because of the bulls’ new plan for breaking the bullish pattern and their takeover of the EOS market. This bullish tendency may cause the whales to shift. The daily price chart could undergo a significant shift as a result of the whale’s movement. The bears may attempt to join the deal and influence the coin’s price.
Eos’s price currently trades around $1.24 and has increased by about 5.41% during the intraday trading period. The bears must take action right away. As the bulls have moved the coin’s price into their favour, the bears have attempted to join the trade in an effort to push the price back into the bulls’ favour. However, the bulls have defeated the bears’ plan, and the bears have since given up.
If the bulls are successful in their future plans and the bears remain halted, the price may rise as high as the primary resistance at $1.27 and the secondary resistance at $1.33. The primary support level of $1.08 may be reached if the bulls come into play. And the price could rise as high as the approximate $0.992 secondary support.

During the intraday trading period, there was about 69.96% rise in volume. But the volume has been gradually declining, which suggests that the coin’s short-selling pressure is waning and that buyers are exerting too much effort to boost demand. As the bears started trading, the bullish tendency started moving forward. Market capitalization to circulation is 0.1319.
The Technical Analysis of EOS

Technical indicator shows that the relative strength indicator is in the overbought region and as buying volume rises, the RSI is moving further into the overbought region. The RSI at this moment is 58.70, and the average RSI is 53.17. Price continues to lag behind the 20, 50, 100, and 200 days Daily Moving Average. Positive crossing resulted from the intersection of the MACD and MACD indicators.
Conclusion
The EOS price has shown a bullish tendency, with the bulls taking control of the market and weakening the bears. There has been a significant increase in volume during the intraday trading period, indicating a rising demand for the coin. Technical analysis shows that the RSI is in the overbought region, and the price is lagging behind the daily moving averages.
Technical Levels
Support Levels: $1.08 and $0.992.
Resistance Levels: $1.27 and $1.33
Disclaimer
The views and opinions stated by the author, or any people named in this article, are for informational ideas only. They do not establish financial, investment, or other advice. Investing in or trading crypto assets comes with a risk of financial loss.
 thecoinrepublic.com