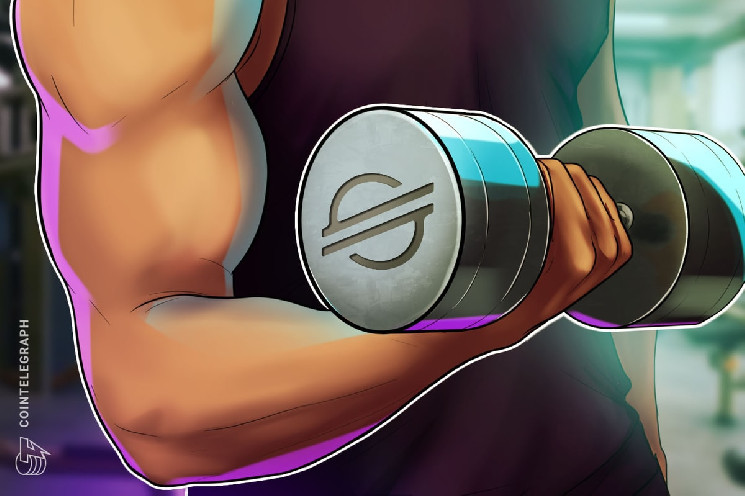
The price of Stellar ($XLM) rebounded 15% versus its arch-rival $XRP ($XRP) two days after the $XLM/$XRP pair set a record low of 0.181.
Notably, the $XLM/$XRP pair rose to its intraday high of 0.20 $XRP on March 31, a move that coincided with a decoupling between Stellar and $XRP in the U.S. dollar market. For instance, $XLM's price has jumped over 11% since March 29 versus $XRP's 3% decline.
$XLM price eyes 10% gains versus $XRP in April
On a broader timeframe, $XLM has dropped 89% versus its peak of 1.655 $XRP in January 2021. Interestingly, the peak formed a month after the U.S. Securities and Exchange Commission sued Ripple for allegedly selling securities in the form of $XRP tokens.
The SEC vs. Ripple case is now nearing its conclusion with legal experts favoring a win for Ripple.
Meanwhile, $XLM continues its long-term downtrend against $XRP, though a rebound in April is on the cards.
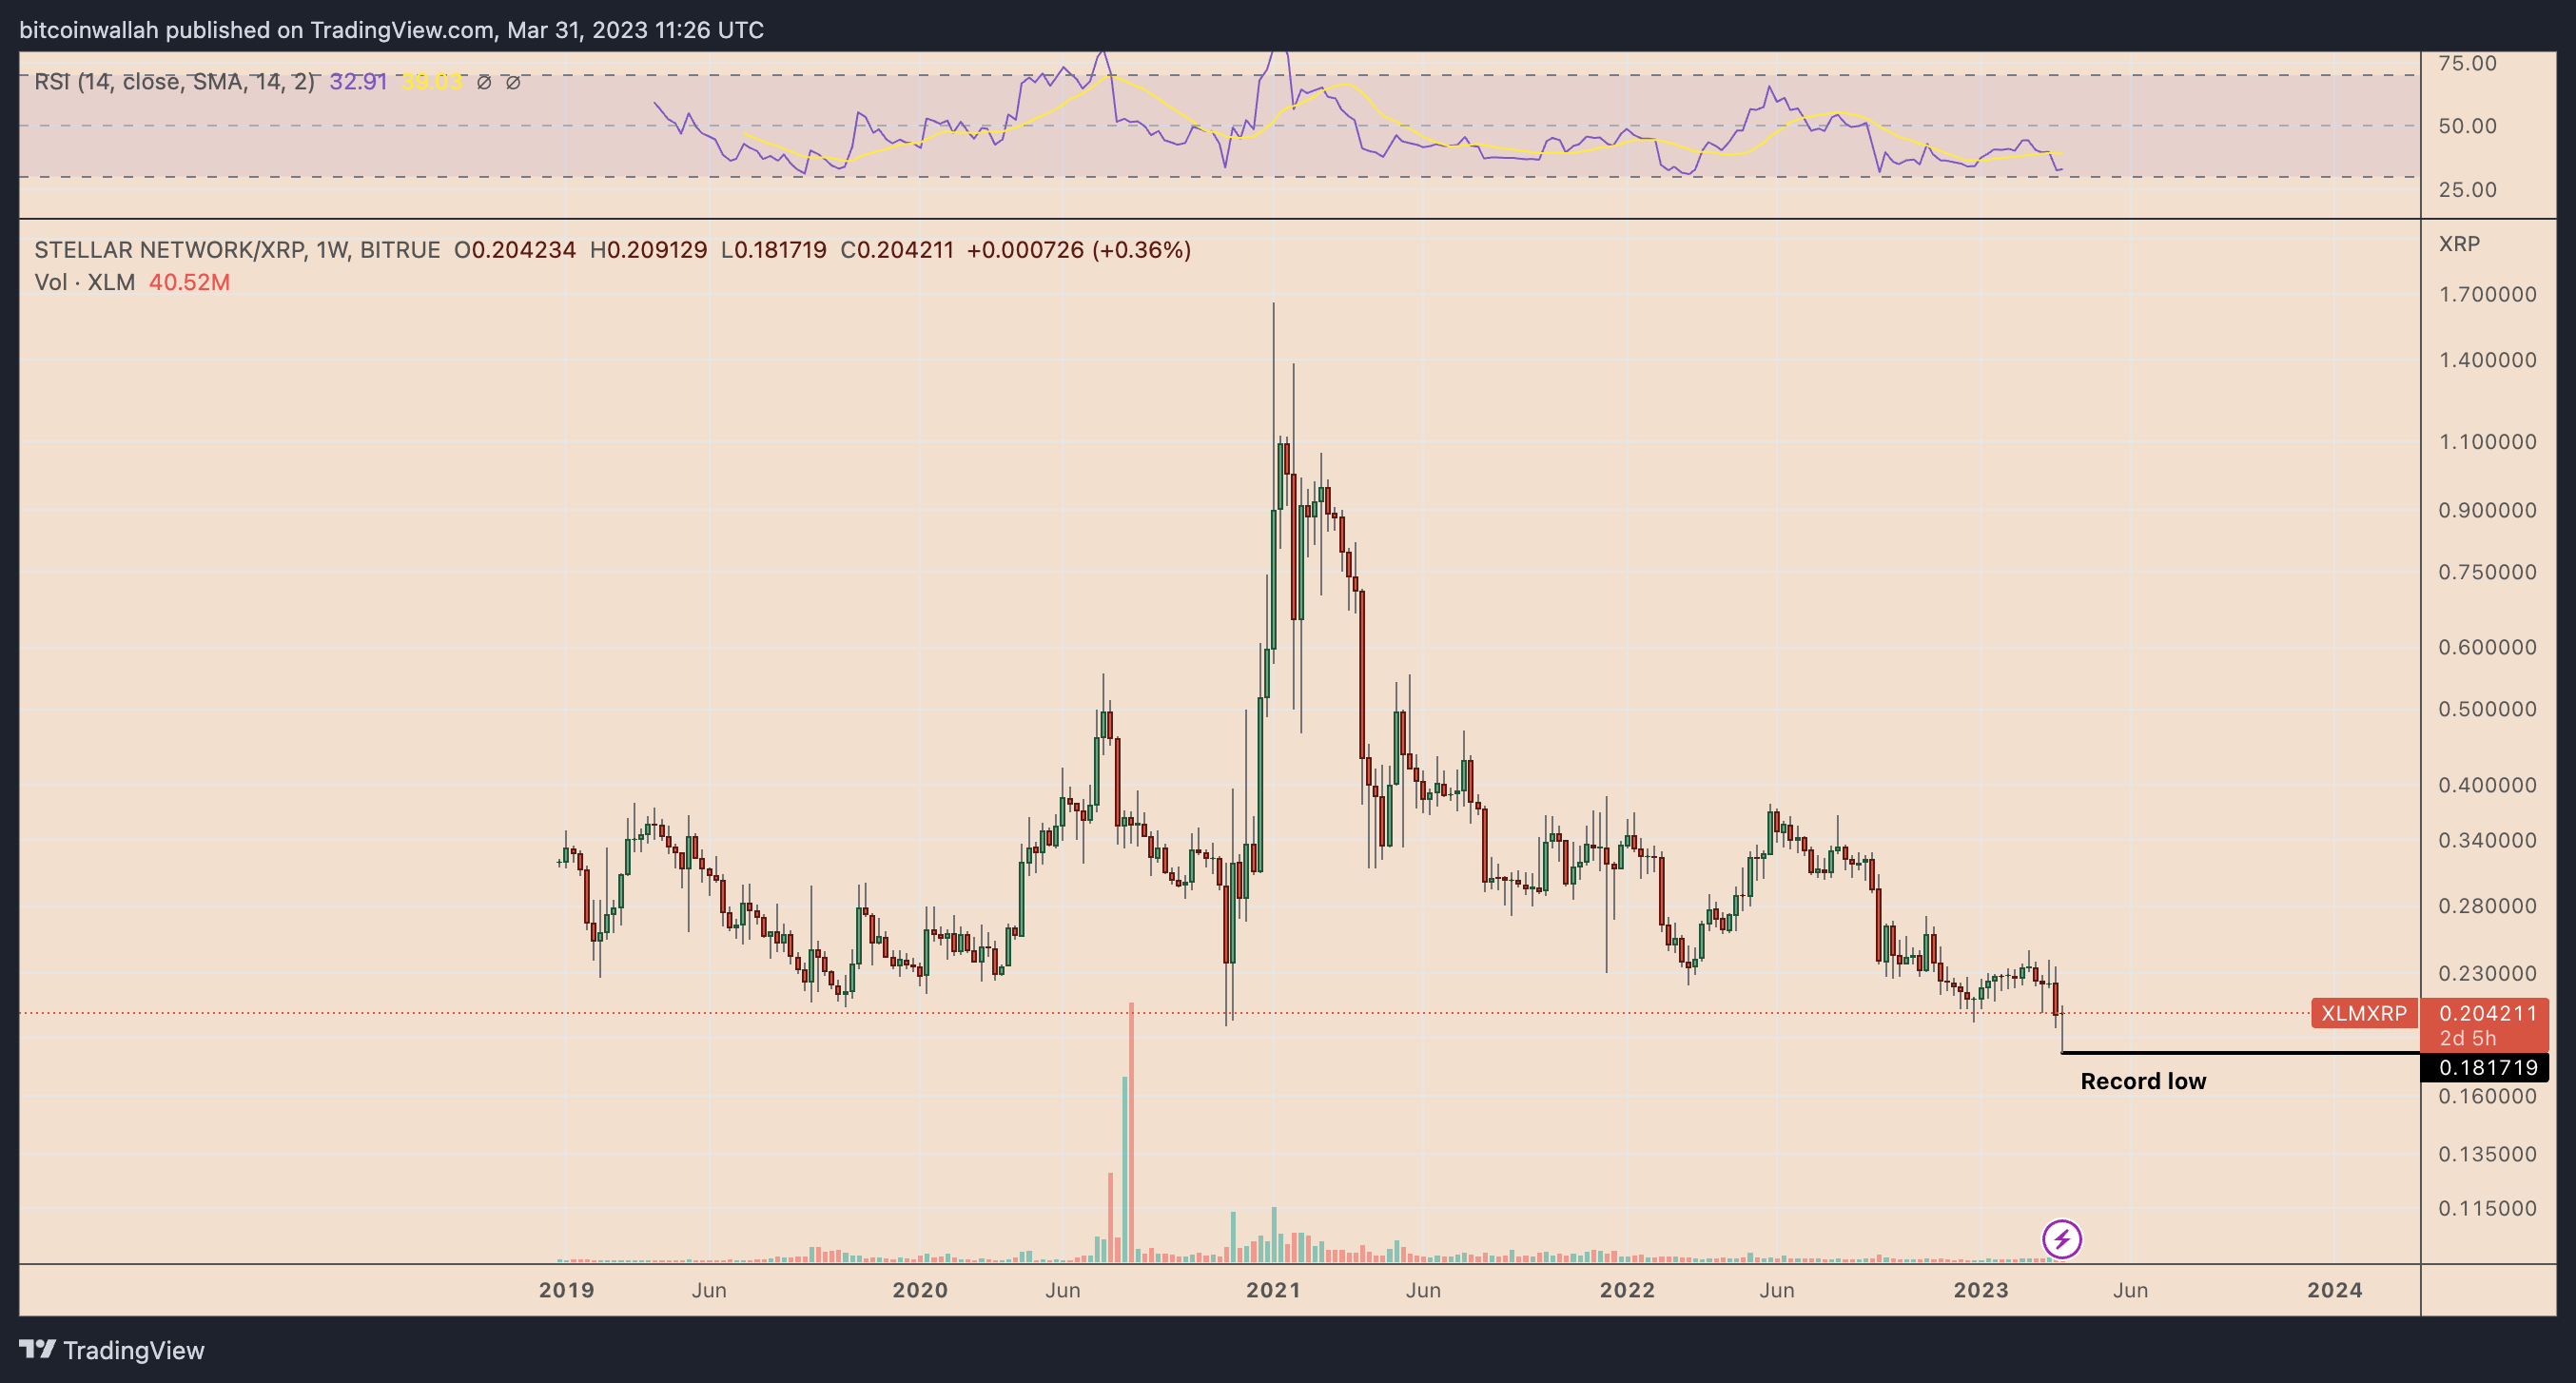
On the daily chart, the $XLM/$XRP's ongoing recovery started at its multi-month descending trendline resistance, which constitutes a falling channel, as shown below.
The pair now looks toward flipping the 0.198-0.207 $XRP resistance range as support to eye a run-up toward 0.22 $XRP in April, up 10% from current prices.
$XLM looks equally bullish versus the U.S. dollar
Stellar price rallied more than 25% in March to reach $0.113, its highest level in four months. $XLM is now positioned for a potential short-term price correction in the first week of April, followed by a rebound rally to new yearly highs.
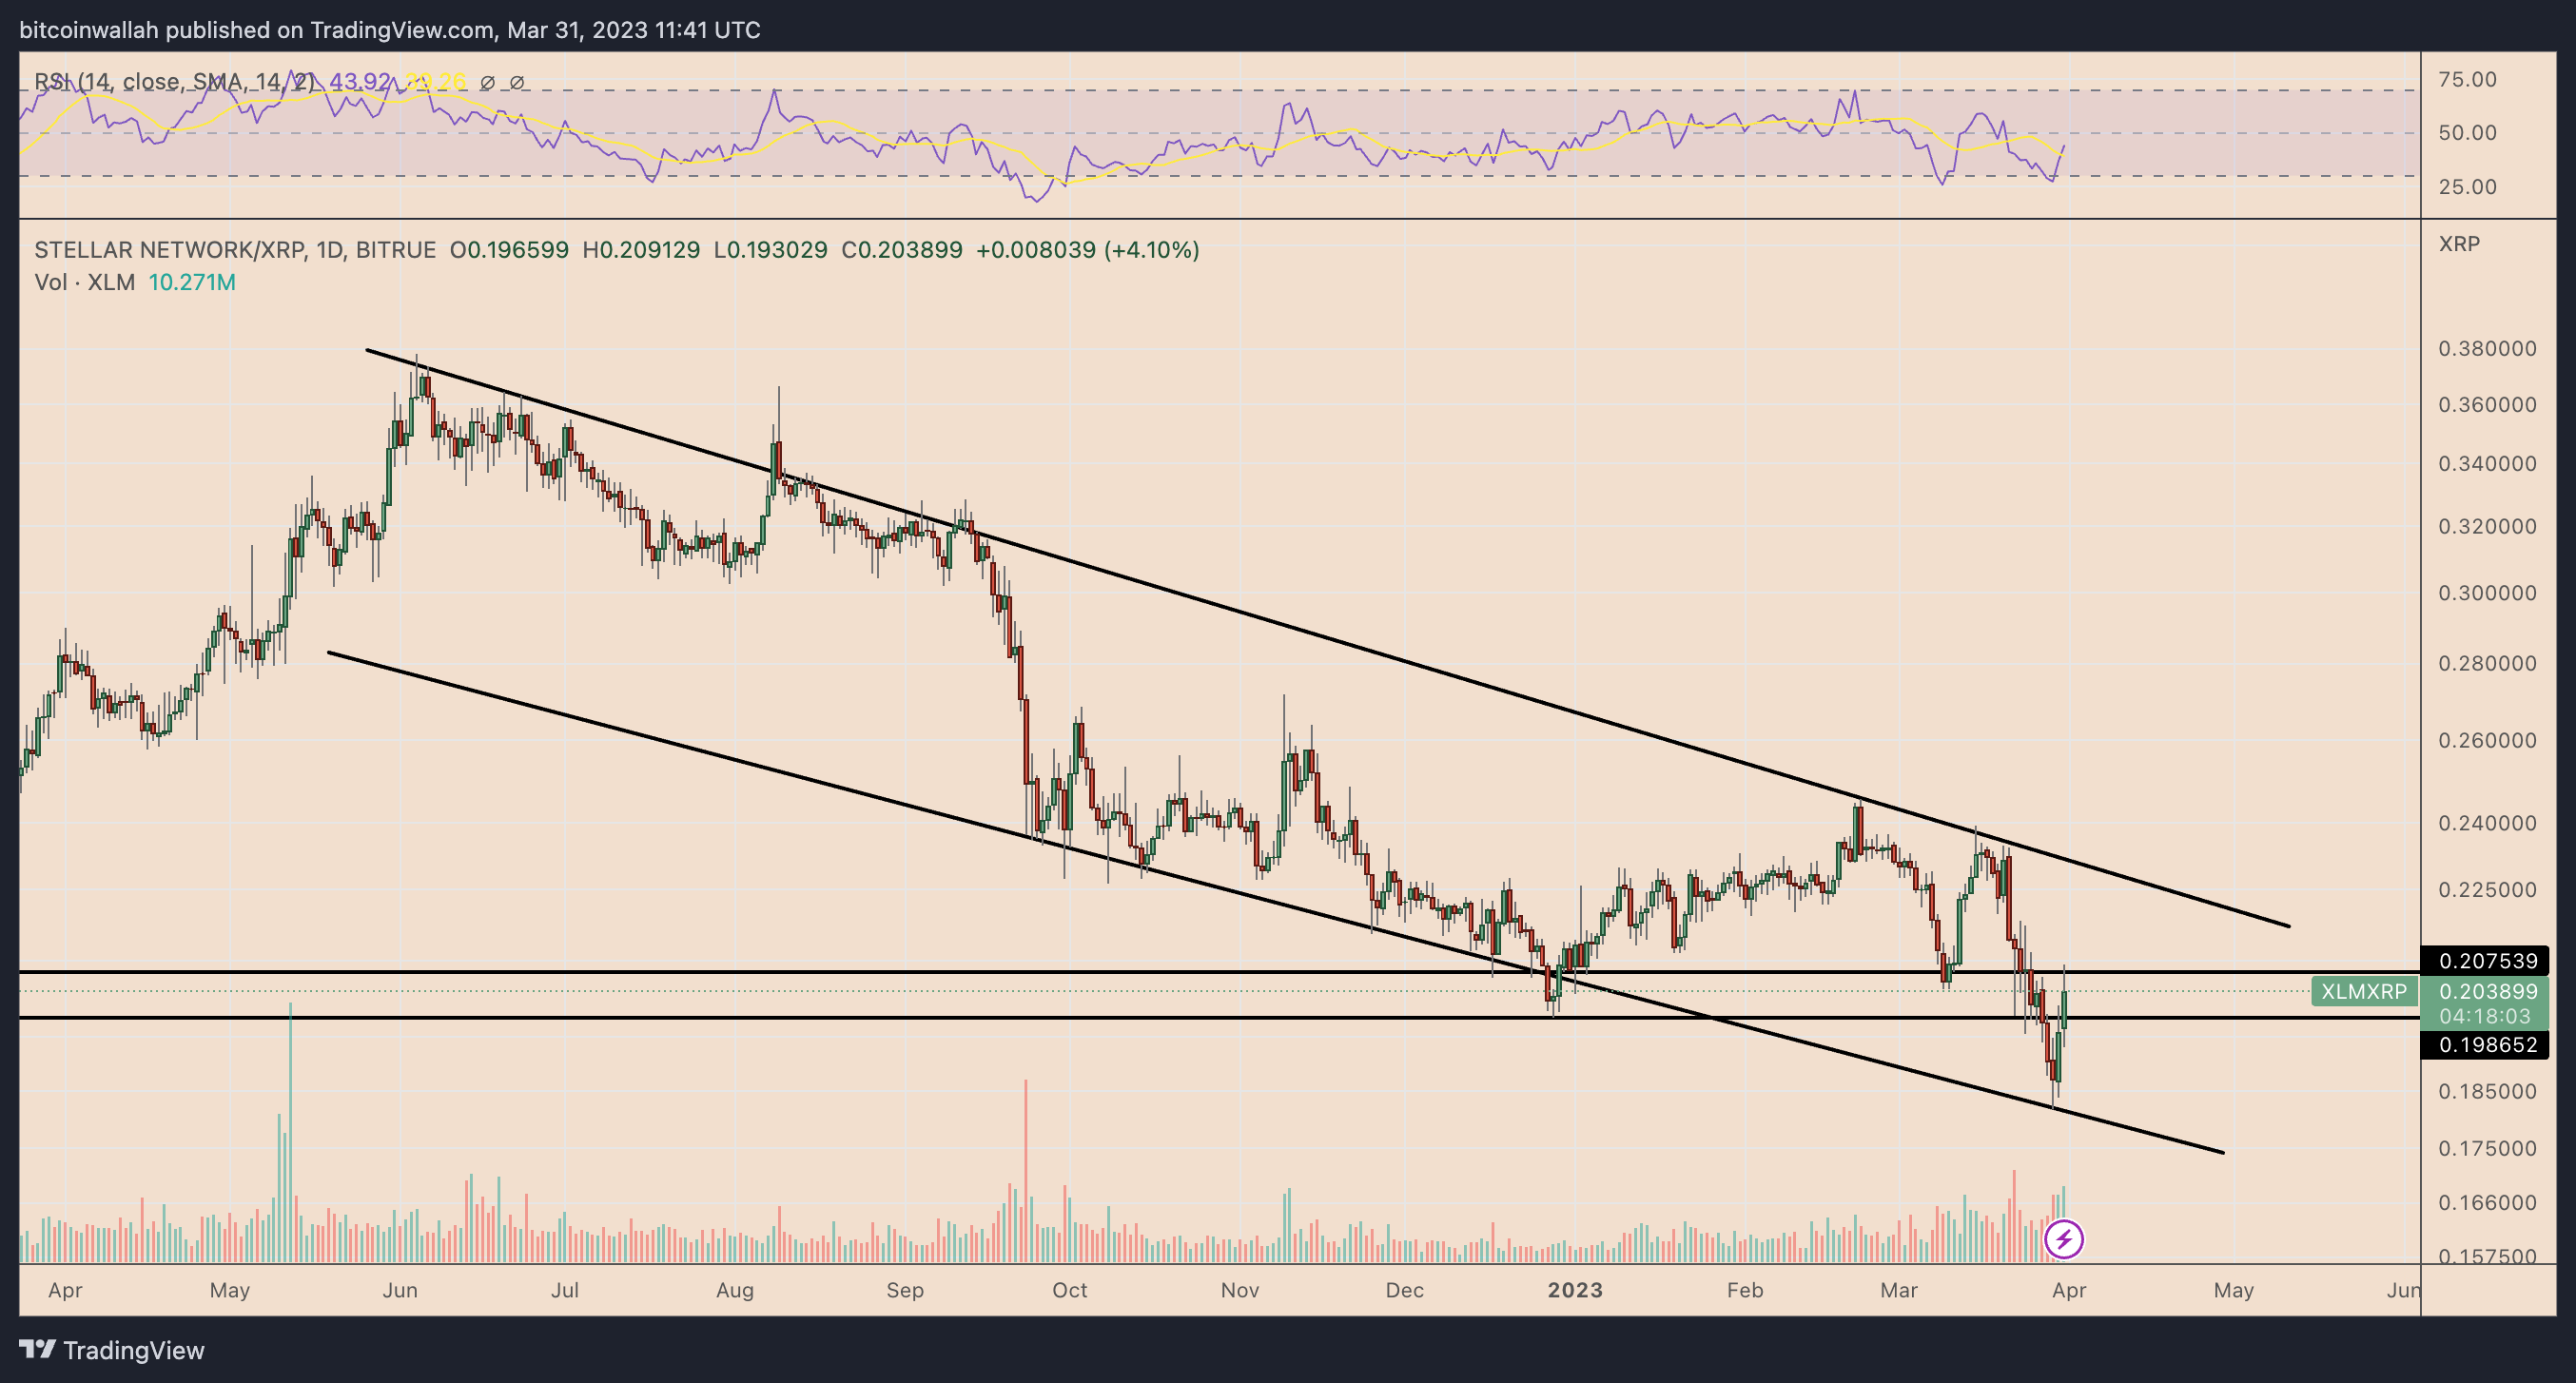
At the core of this bullish outlook is a classic technical pattern dubbed cup-and-handle. The pattern forms when the price undergoes a U-shaped recovery, or cup, followed by a consolidation period, i.e. the handle, all under a common resistance level called neckline.
Meanwhile, it resolves after the price breaks above the neckline and rises by as much as the distance between the cup's bottom and neckline.
Notably, $XLM has been painting a similar cup-and-handle since November 2022. $XLM/USD entered the pattern's breakout stage during its price boom in March and is now 20% away from reaching the breakout target near $0.131.
Nonetheless, $XLM's daily relative strength index (RSI) has entered its overbought zone above 70, suggesting a consolidation or correction period in the first week of April. As it happens, $XLM price risks correcting toward its neckline at around $0.095, down 12% from current price levels.
Related: Why is $XRP price up today?
Ideally, traders perceive such corrections as a method to analyze cup-and-handle's breakout strength. So the breakout scenario will be confirmed when the price bounces from the neckline, accompanied by a rise in trading volumes.
Conversely, if the price closes below the neckline with a rise in volumes, it risks invalidating the cup-and-handle breakout scenario altogether.
This article does not contain investment advice or recommendations. Every investment and trading move involves risk, and readers should conduct their own research when making a decision.