- 1 ICP price down by 42% from the recent swing high at $8.239.
- 2 ICP crypto price failed to hold the 200 day EMA showcase downtrend.
- 3 The pair of ICP/BTC is trading at 0.0002108 with intraday loss of -0.85%.
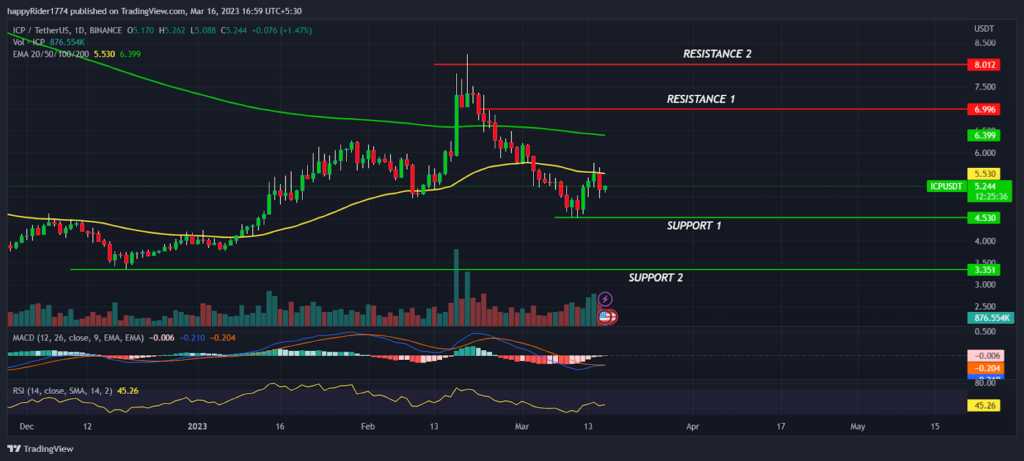
ICP price is down by 42% from the recent peak at $8.239 and trading below the 200 day EMA showcase downtrend. ICP crypto price falling for 20 consecutive sessions and forming lower low candles indicates the prices are into strong bear grip. However, recently the downfall halted near $4.500 support and showed minor recovery from the lower levels.
ICP price currently trading at $5.244 with an intraday gains of 1.47% and volume to market cap ratio at 0.0385. The pair of ICP/BTC is trading at 0.0002108 with intraday loss of -0.85%. At the beginning of January, ICP price climbed above the 50 day EMA which triggered the positive sentiment and turned the short term trend in upward direction.
ICP price gained momentum and rallied 90% approx in the period of one month. During the rally, minor profit booking is also visible but prices bounce back by taking support at the 50 day EMA. At the mid of February, ICP price attempted to break out of the 200 day EMA to reverse the positional in favor of bulls but sadly prices got rejected from higher levels. Later, the overall market sentiment turned bearish and ICP prices reverted in the downward direction. Therefore, $7.00 and $8.00 will act as a strong hurdle in the coming months.
Will ICP price rise again?

ICP price downfall halted at $4.500 and showed recovery of 20% approx from the recent low indicates buyers are active at the lower levels. However, ICP price is near to the 50 day EMA which will act as an immediate hurdle in the coming days. The technical analysis suggests ICP is in bear grip and expected to trade in the range between $4.500 to $7.000. However, if the overall market sentiment improves then ICP price might see positive turnaround and it may attempt to rise again.
ICP crypto technical indicators like MACD curve are reversing upside and trying to generate a positive crossover but confirmation is still awaited. The RSI at 44 sloping sideways denotes prices near the neutral zone and likely to trade sideways.
Conclusion
ICP price down by 42% from the recent peak and trading below 200 day EMA showcase downtrend. However, the ICP crypto is near to the demand zone and may see short term recovery. The technical analysis suggests that the prices are into bear grip and expected to trade in the wide range with a bearish bias.
Technical levels
Resistance levels : $7.000 and $8.000
Support levels : $4.500 and $3.350
Disclaimer
The views and opinions stated by the author, or any people named in this article, are for informational purposes only, and they do not establish financial, investment, or other advice. Investing in or trading crypto assets comes with a risk of financial loss.
 thecoinrepublic.com