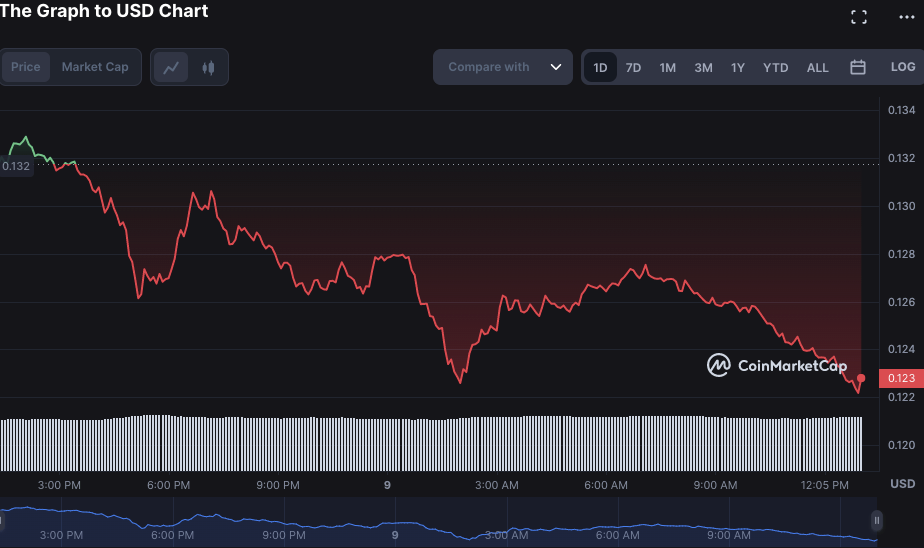
The Graph price analysis shows that it is trading in a negative environment, with the bears having a strong grip on the market. GRT is currently standing at the low of $0.1225, with a loss of more than 7.10% in the last 24 hours of trading. The GRT token continues to move in a bearish channel, with the bears having more control over the market.

The current trend, if it continues to remain bearish, could lead to the GRT token falling below the $0.1225 support level. The resistance level for the GRT token is set at $0.1245, with a break above this level bringing bullish sentiment back into the market. However, if the bears can maintain control and push the price lower, then it could lead to more downside pressure on the GRT token.
The volume analysis also indicates a continued negative trend for the GRT token. The trading volume has been falling steadily since the past week and is currently at a low of $56 million. The market cap stands at $1.08 billion, having a loss of 7.11% over the last 24 hours.
The daily chart for the Graph price analysis shows that the bears are in full control of the market as selling pressure continues to increase. The bearish pressure has been dominating the market over the past few days and could continue to do so in the upcoming days. The market for today opened today’s session at $0.128, but the bearish pressure has seen the price fall to the current level of $0.1234.
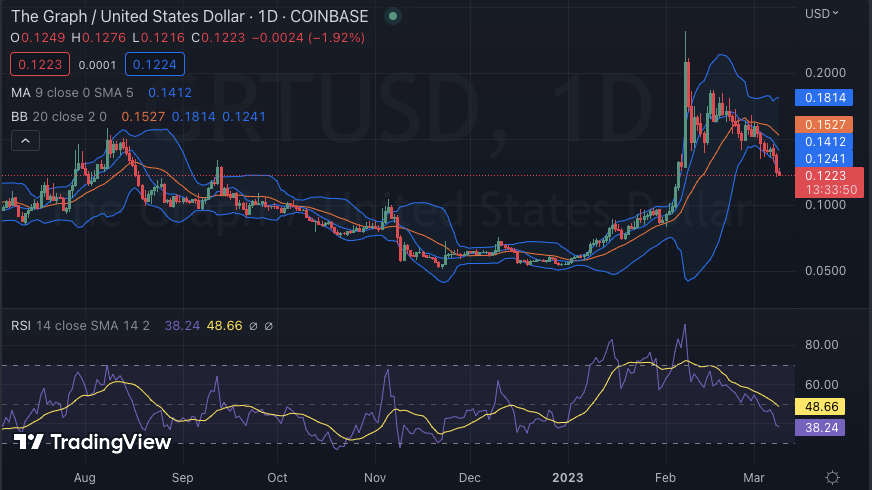
The technical indicators for the GRT token are also trending downwards, with the Relative Strength Index (RSI) currently at a level of 41.63, indicating that the bearish momentum is still strong and could cause further downside pressure in the upcoming days. Additionally, the RSI is in the oversold region, which could lead to a short-term reversal in the market.
The 20-SMA and 50-SMA indicators also show that the GRT token continues to remain in a bearish zone. This indicates that there is still strong selling pressure in the market, and if it persists, then it could lead to further losses for the GRT token. The daily moving average (MA) value is at $0.1412, indicating that there is still an uphill battle for the bulls in order to break this resistance level.

Looking ahead, The decrease in volatility is an indication of the consolidation phase that the GRT market is currently in. The Bollinger Bands are trending downward, with the upper band at $0.1814, which may act as a strong resistance level in the near term, while the lower band at $0.1241 could be seen as a strong support level.
Overall, the GRT market is currently under a bearish sentiment, with the bulls failing to push past key resistance levels. The support level for the cryptocurrency is present at $0.1225, and if this level is broken, then it could lead to further losses for the GRT token. The selling pressure is still strong and could continue dominating the market in the upcoming days.
Disclaimer: The views and opinions, as well as all the information shared in this price analysis, are published in good faith. Readers must do their own research and due diligence. Any action taken by the reader is strictly at their own risk, Coin Edition and its affiliates will not be held liable for any direct or indirect damage or loss.
 coinedition.com
