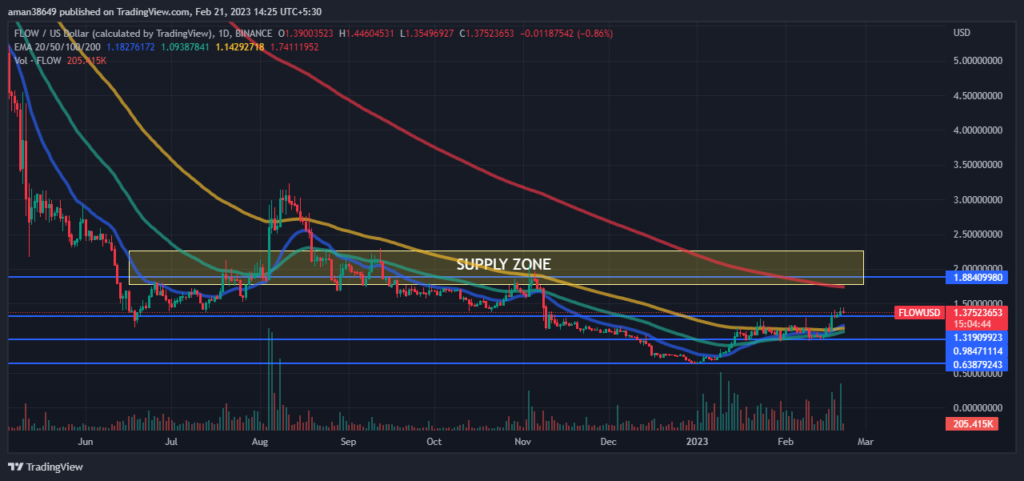
- Flow Token was currently at $1.41 with a decrease of 0.47% during the intraday trading session.
- The 24-hour low of FLOW was $1.36 and the 24-hour high of FLOW was $1.42.
- The current Flow price is above 20, 50, and 100-Days EMA.
The pair of FLOW/BTC was currently trading at 0.00005624 BTC with a dip of 2.41% over the intraday trading session.
Flow price analysis suggests that currently in a bullish trend. 2022 was a very volatile year for FLOW because of the many ups and downs throughout the year it can also be said that 2022 was not a good year for FLOW because, throughout the whole year, FLOW was mostly in a downtrend which indicates that sellers dominated the market mostly. Near the end of 2022 sellers continuously pushed FLOW downwards forcing FLOW to make its all-time low on the last day of 2022. But after the start of 2023, FLOW started rising even breaking its primary support of $0.984. But after breaking the primary support FLOW became consolidated between its primary resistance of $1.3190 and its primary support.
But after the appearance of the bullish marubozu candlestick pattern over the daily trading chart FLOW again started rising and breaking its primary resistance which indicates that bulls have control over the market. If buyers support FLOW and push themselves then it may even reach its secondary resistance of $1.884 and may even enter its supply zone. This can be a piece of good news for the long traders.

The volume of the coin has decreased by 2.63% in the last 24 hours. The decrease in volume indicates that the number of sellers has increased. This shows that sellers are trying their best and there is a relationship between volume and the price of FLOW, which represents strength in the current trend.
The technical analysis of FLOW:

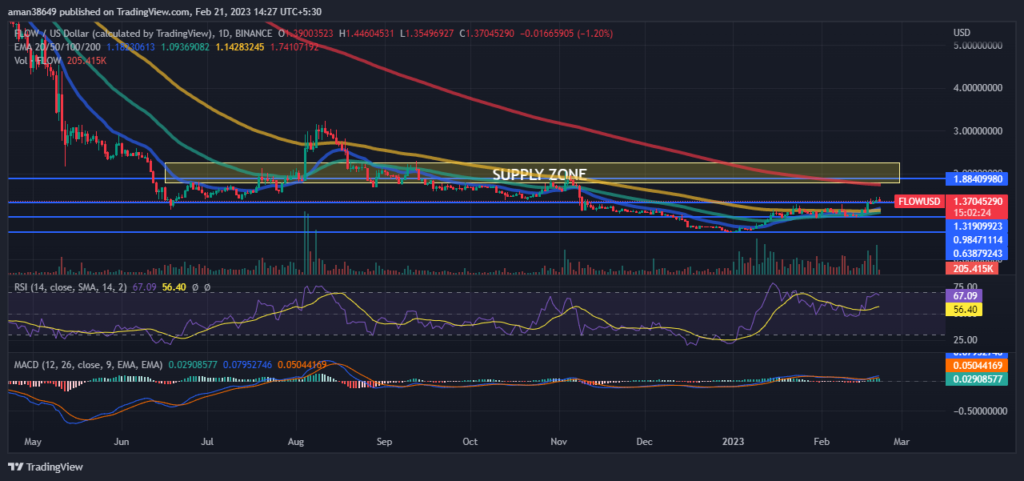
RSI is increasing in the overbought zone and reaching the extremely overbought zone which indicates that the current uptrend is near its end. The current value of RSI is 67.05 which is above the average RSI value of 56.40.
The MACD and signal are decreasing and intersecting but not giving any definitive crossover. Investors are watching every move in the market carefully.
Conclusion
Flow price analysis suggests that FLOW is in an uptrend. Flow made its all-time low on the last of 2022, but after the start of 2023, it started increasing, breaking its primary support. But after that FLOW started consolidating between its primary resistance and support. But after the appearance of marubozu bullish candlestick FLOW again started increasing. But the decrease in volume indicates a lack of confidence in traders. RSI is increasing and reached its extremely overbought zone which indicates that the current uptrend is nearing its end and MACD has not given any evidence to support RSI, as per the technical indicators.
Technical Levels-
Resistance level- $1.3190 and $1.884
Support level- $0.984 and $0.638
 thecoinrepublic.com
