The VeChain (VET) price shows signs that it has completed its correction and could soon begin a massive upward movement.
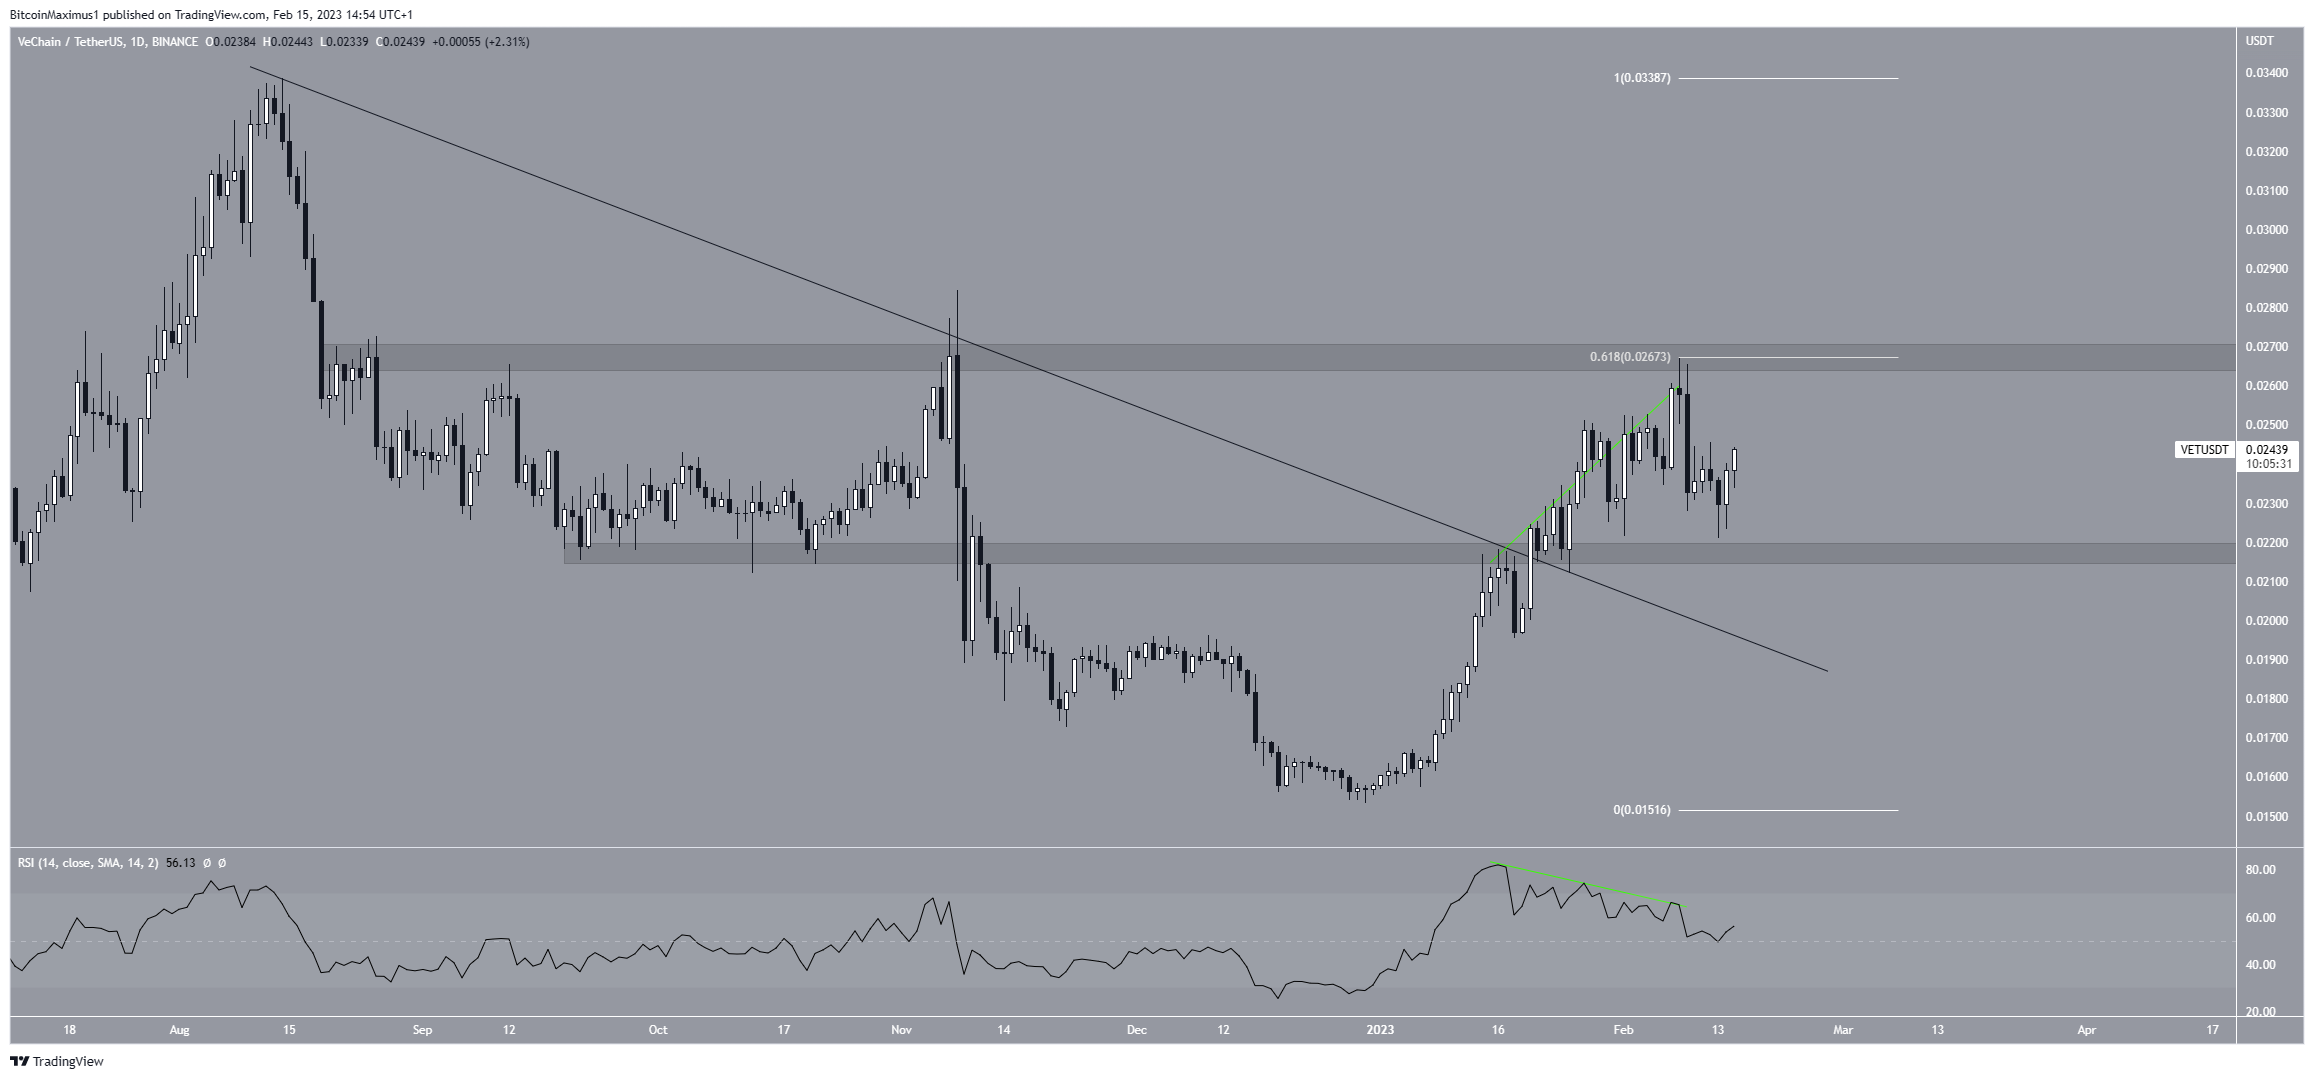
The VeChain price broke out from a descending resistance line on Jan. 20. Afterward, it increased until it reached a high of $0.027 on Feb. 8. The high was made right at the 0.618 Fib retracement resistance level and a horizontal resistance area.
Shortly afterward, the VET token price fell sharply, reaching a minimum price of $0.022. The entire decrease was preceded by bearish divergence in the daily RSI. However, the indicator is still above 50, allowing for the upward movement to continue.
If the digital asset successfully breaks out above $0.027, it can increase to $0.033. On the other hand, if the movement loses momentum again, the closest support area for VET would be at $0.022.

VET Price Wave Count Predicts Breakout
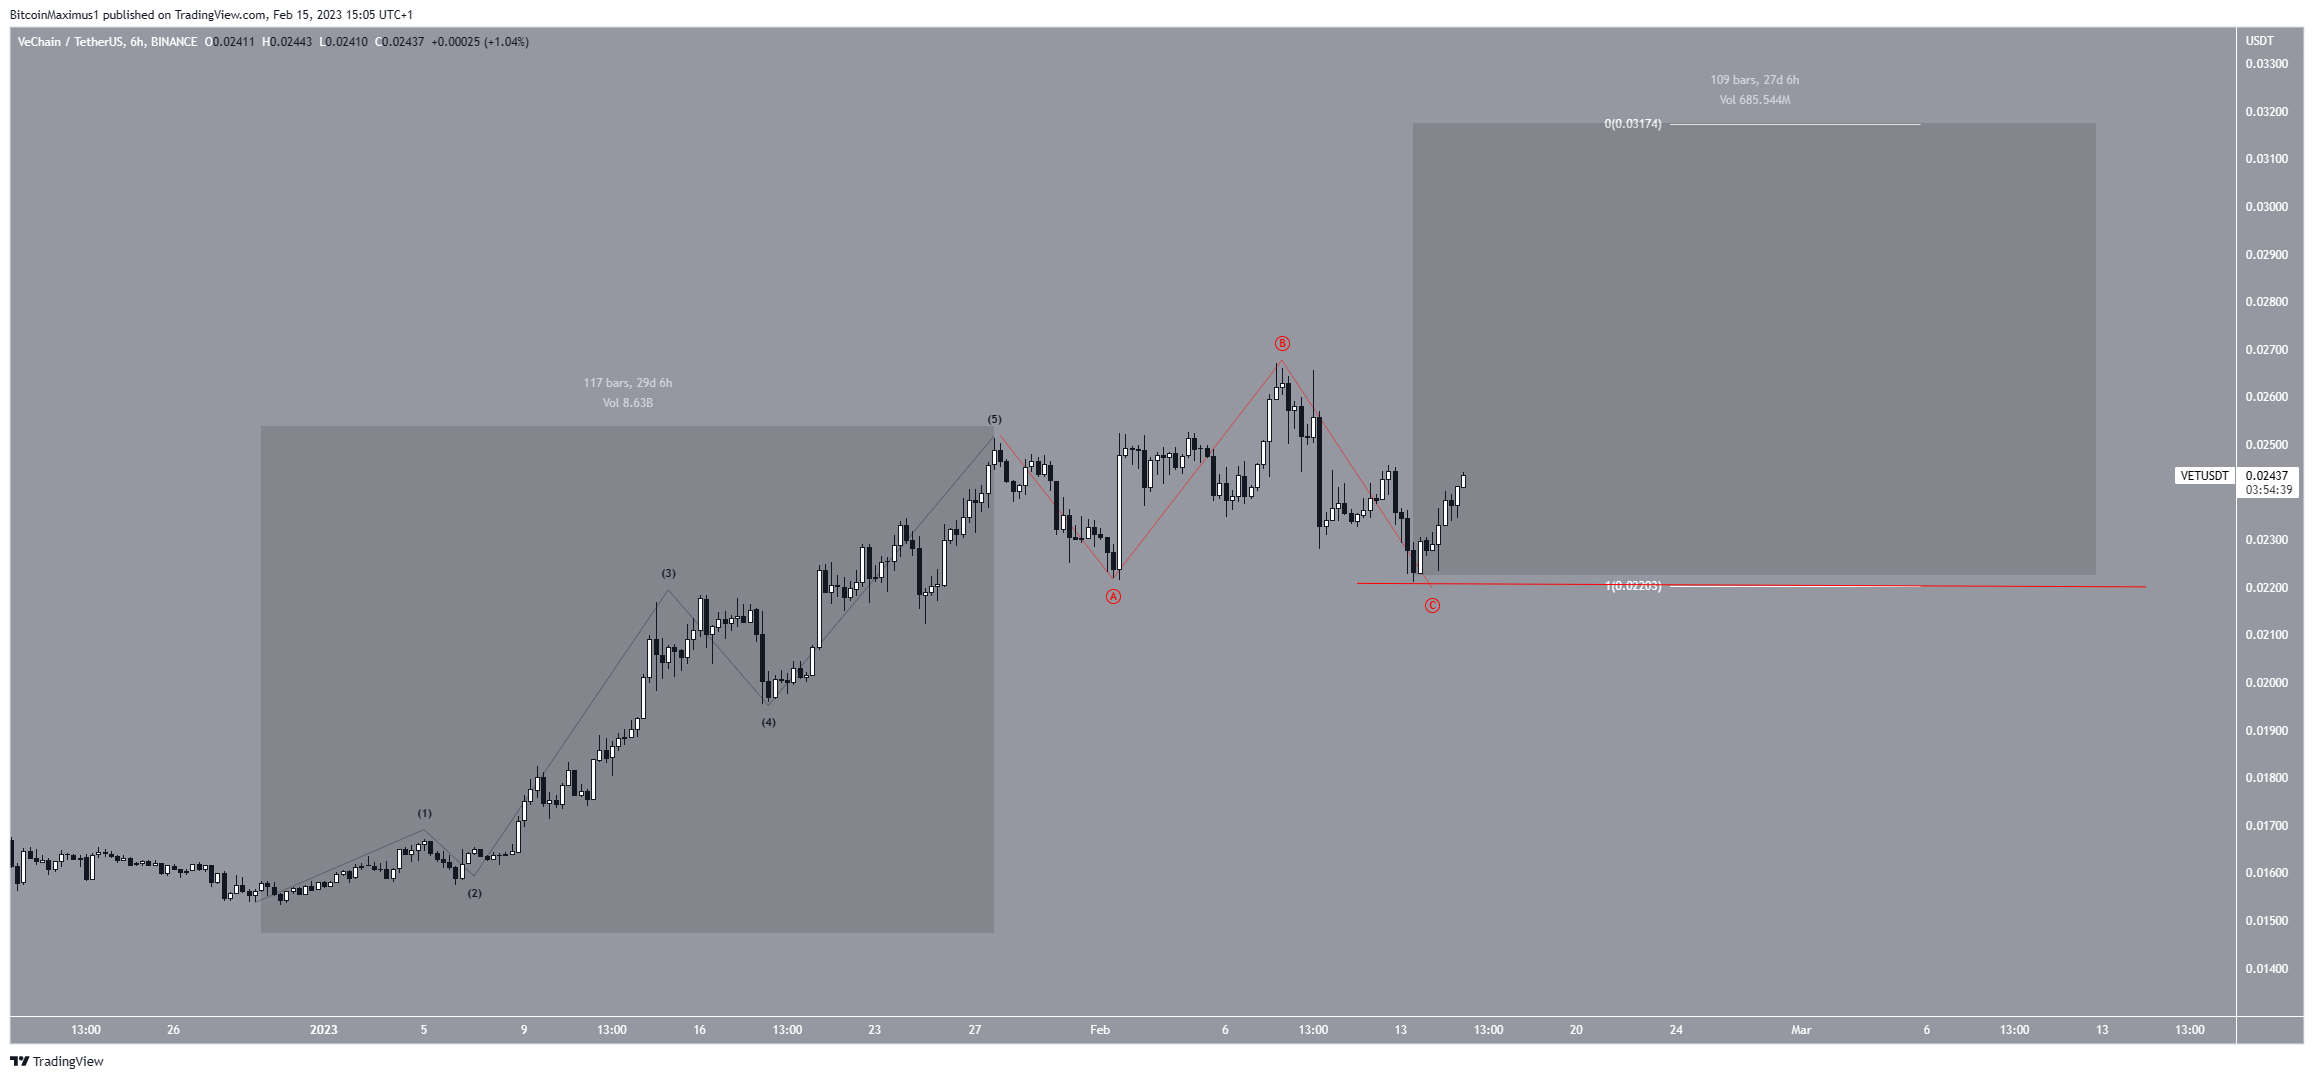
Measuring from the yearly low, the VET price has completed a five-wave upward movement (black). Then, the ensuing drop looks like an irregular flat correction (red).
If so, the VET price has completed its decrease and will now resume its upward movement.
If both long-term upward movements have a 1:1 ratio (highlighted), the VET price can increase all the way to $0.033, the previously outlined long-term resistance area.
However, a decrease below the $0.022 Feb. lows would invalidate this bullish forecast. In that case, the VET price could fall to the descending resistance line at $0.017.

To conclude, the most likely VET price forecast is the continuation of the increase toward $0.033. However, a drop below $0.022 would invalidate this bullish forecast and could cause another drop to $0.017.
For BeInCrypto’s latest crypto market analysis, click here.
 beincrypto.com
