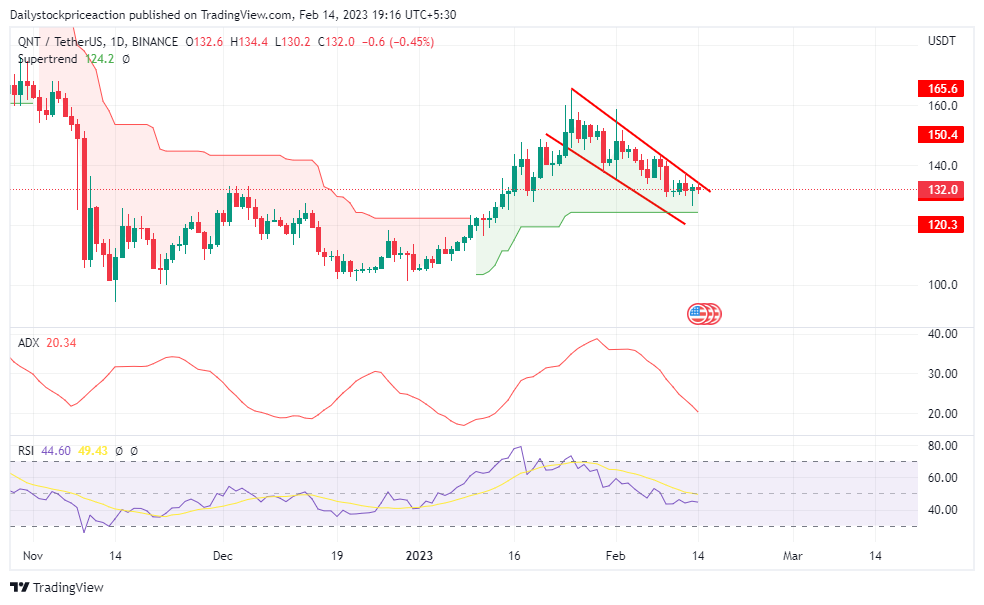
- The QNT token price is hovering around the supply zone on a daily time frame as it moves strongly off the demand zone.
- At present, QNT token price is forming a flag and pole pattern on a daily time scale.
- The pair of QNT/ BTC is transacting at the price level of 0.0060984 with an increase of +3.91% in the past 24 hours.
The QNT token price as per the price action is super bullish and has been moving up strongly. At present , the token price is in a mandatory consolidation after showing a steep move in the previous week. QNT token price is consolidating from the past 4 days forming an indecisive candlestick pattern.
QNT token price fails to hold at the supply zone

QNT token price, once breaks the supply zone it can start moving up again rapidly. Nevertheless the token price has gone past the 50 and 100 Moving averages way back and since then it has been in an uptrend. Moving upwards the token price can be seen resting at these MAs during the pullbacks. At present, the token price is forming a higher high and higher low formation on a daily time frame.
QNT token price is bullish and the same is depicted in the bollinger band indicator. Prior to the current movement the token price was trading at the lower band off the bollinger band indicator but after bouncing off the demand zone the token price is currently trading at the upper band of the bollinger band indicator. Volumes have increased as the token price rose. Although investors should remain cautious and wait for a proper breakout and then act accordingly.
QNT token price is forming a fag and pole pattern on a daily time frame

ADX curve has been rising on a higher time frame as the token continues to rise. It is a positive sign for the token price. In a daily time frame, the ADX curve has dipped out of the 20 mark and has turned upwards. As the token price rests at the short-term demand zone on a 4-hour time frame. Investors should wait for a positive candle formation at the demand zone.
RSI curve is trading at the level of 44.80. The RSI curve is yet to cross the halfway mark of 50. The QNT token price has given a breakout of a strong small-term supply zone on a daily time frame. Once the token price breaks the rounding bottoms pattern, the RSI curve can be seen moving up rapidly. The RSI curve has crossed the 14 EMA yellow line indicating a short-term bullishness. The breakout of the bullish chart pattern will result in the RSI curve crossing the mark of 50, supporting the breakout.
The QNT token price has been rising since the past week and has started consolidating before showing a further move. Before the bullish momentum, the token price was consolidating the demand zone and continuously facing s strong bearish pressure from the supertend sell line. But recent movement in the token price has triggered a bullish trend in the supertrend parameters as it gave a buy signal moving upwards the token price can be seen resting at the super trend buy line which will act as a strong demand zone.
Conclusion: The QNT token price as the price auction suggests is bullish and the technical parameters also suggest the same. The token price turned bullish in the last one month and the technical parameters are seen supporting the trend. As of now, the token price is in a strong consolidation and breakout on either side will trigger a big move and therefore the investor should remain cautious and wait for a clear trend and then act upon it.
Support: $125 and $130
Resistance:$157 and $169
 thecoinrepublic.com
