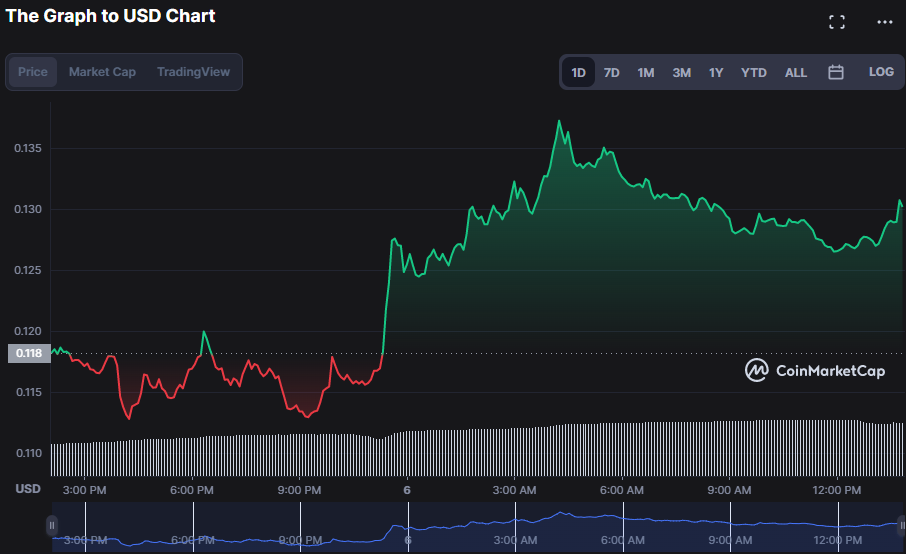
After experiencing a period of adverse sentiment earlier in the day, The Graph’s (GRT) market bullishness has returned, and the price has risen to an intra-day high of $0.1376. As of press time, the bulls had pushed the price up to $0.1297, an 11.09% increase, showing evidence of the market’s upturn.
During the upturn, market capitalization, and 24-hour trading volume increased by 9.82% and 66.02% to $1,143,901,463 and $302,428,153, respectively. This increase in the Graphs’ market cap indicates that investors are becoming more optimistic about the project’s future, and are consequently investing more money into it. Hence as long as investor confidence is high, this positive trend is expected to continue soon.

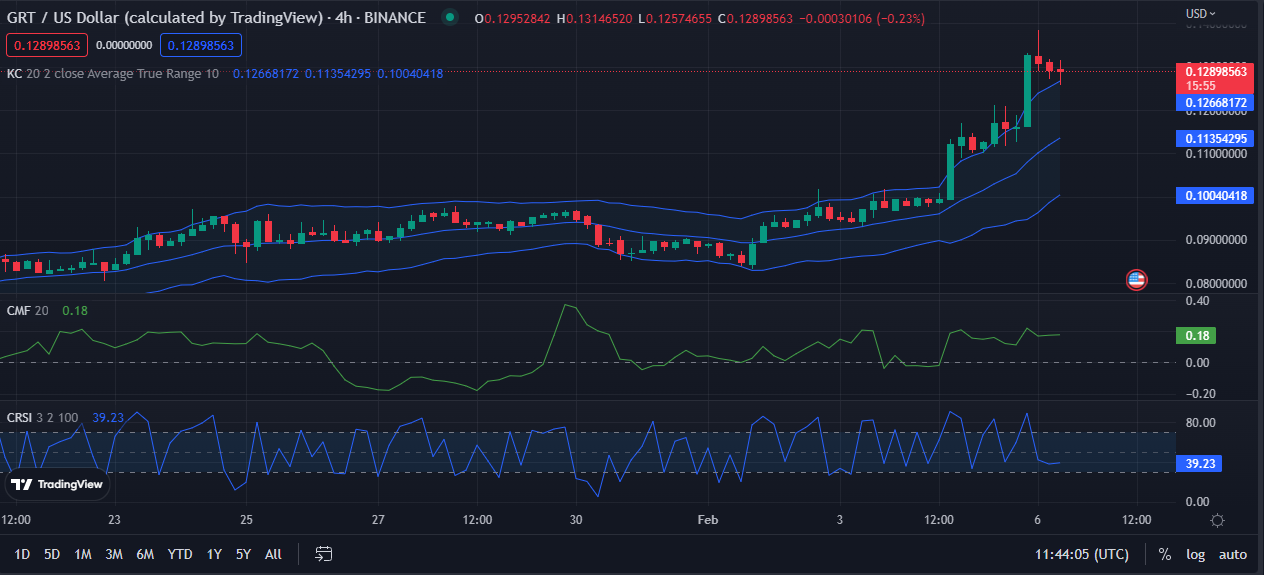
As the Keltner Channel bands advance north, with the upper band at 0.12673673 and the bottom bar at 0.10040689, the bullish momentum grows as more buyers join the market. This move is evidenced by the growing price above the upper Keltner Channel band, indicating that the optimistic feeling will likely persist in the market for some time.
The Chaikin Money Flow (CMF) reading of 0.18 strengthens this view since it indicates substantial market purchasing pressure. Furthermore, the rising volume adds to the purchasing pressure, confirming the positive attitude.
With a Connors RSI of 61.13 moving north, the market’s bullish trend is anticipated to continue in the short term. This movement indicates significant underlying momentum for the stock, which signals that the present positive market trend will continue for some time. This might be a terrific opportunity for traders to profit from, as the stock has the potential to hit new highs soon.

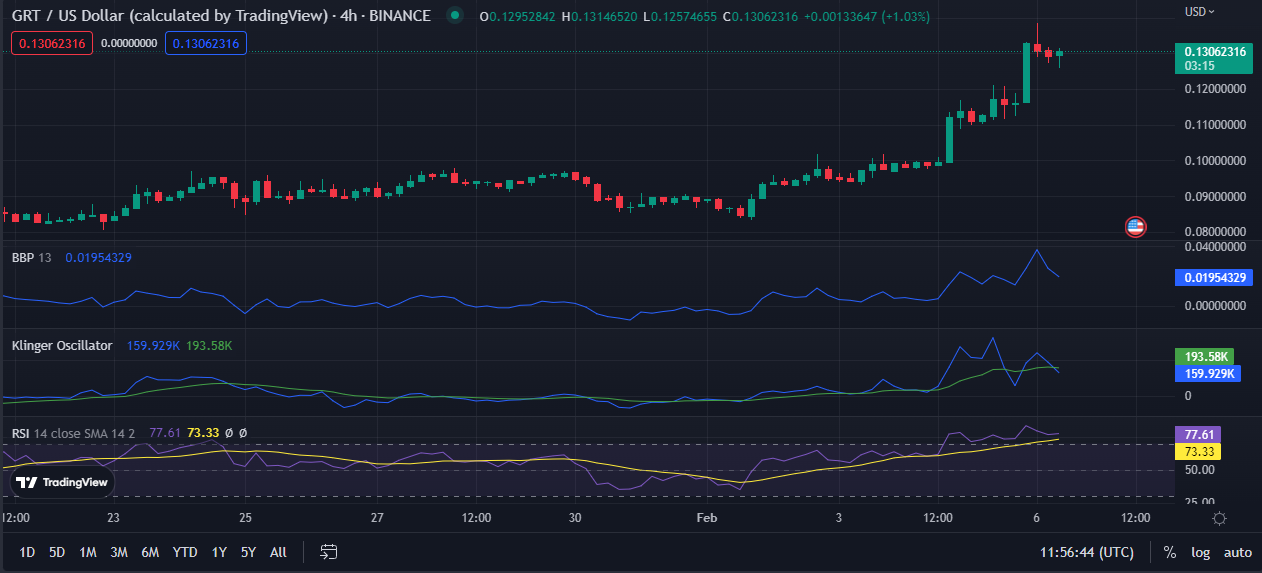
With a Bull Bear Power (BBP) reading of 0.01993073, the optimistic attitude in the market is fading, and a correction is possible. This movement indicates that the market has reached saturation, which may suggest that the present rising trend will not continue in the long run. As the BBP rating declines, investors may become more cautious and attempt to decrease their holdings in the market, leading prices to fall in the near term. On the other hand, if investors stay enthusiastic and fresh cash continues to enter the market, prices may continue to climb.
Further evidence that the market may have hit saturation is a Klinger Oscillator value of 160.685K, below the indicator line. This might cause a change in investor attitude, leading market values to stall or even decrease in the near term. This negative notion, exacerbated by a dropping BBP rating, suggests that the capital influx that has supported market prices is slowing. As a result, even if investor mood stays positive in the short term, this might be negated by present technical signs indicating that the market has reached a level of overvaluation and will soon enter a negative phase.

If bulls wish to preserve market dominance, resistance levels must be maintained, and prices in the GRT market must be pushed higher.
Disclaimer: The views and opinions, as well as all the information shared in this price analysis, are published in good faith. Readers must do their own research and due diligence. Any action taken by the reader is strictly at their own risk. Coin Edition and its affiliates will not be held liable for any direct or indirect damage or loss.
 coinedition.com