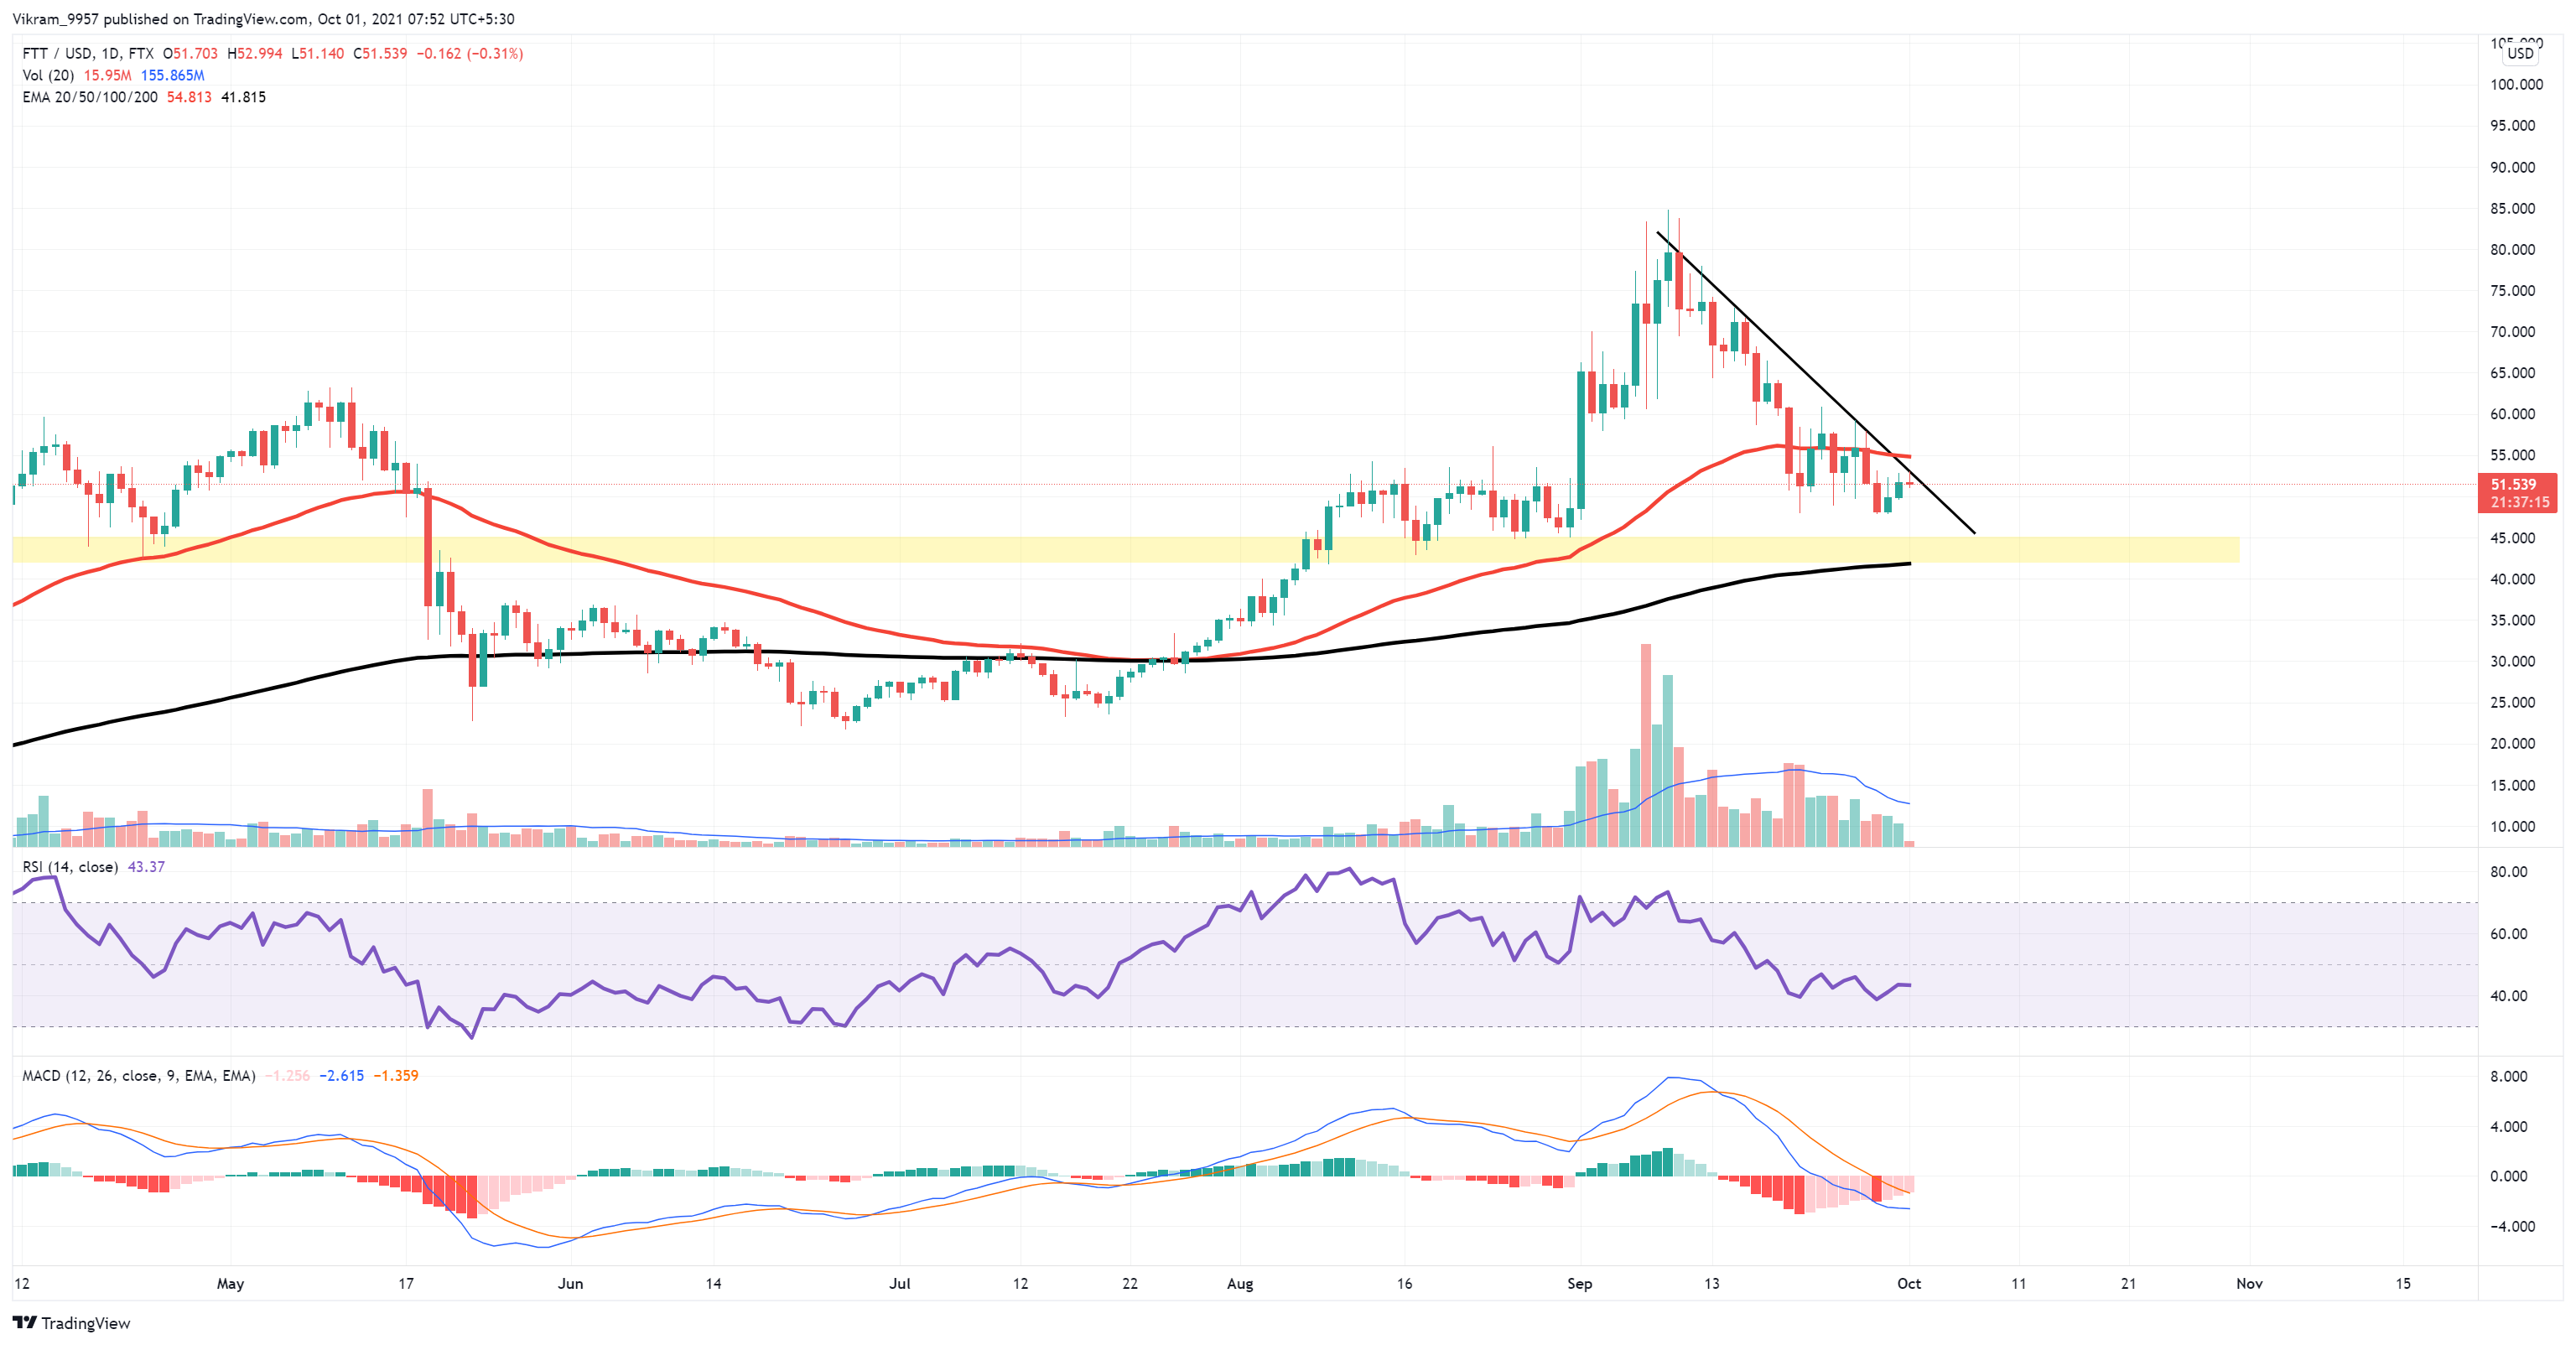
FTT token price is under tremendous selling pressure as it forms a descending triangle. Breakout of this pattern will bring a high momentum move.
Alameda Research backs FTX, a well-known company in crypto trading and one of the largest liquidity providers.
FTX was designed by industry professionals who have demonstrated expertise in the field. They offer a range of services, including collateral, maintenance margin, liquidation processes, and product listing. In addition, FTX claims that they are focused on rapid development, allowing them the ability to implement crypto trading systems at a fast pace.
Let us now look at the technical analysis of FTT cryptocurrency.
Past Performance of FTT
Since September 10th, the FTT coin price is under tremendous selling pressure. Thus, falling lower to the $45 support zone. By forming lower lows under the substantial bearish influence. Thus, generating a resistance trend line. Finally, however, the coin price approaches the support zone near the $45 mark. Thus, forming a descending triangle in the daily chart.

Source - Tradingview
FTT Technical Analysis
At the time of writing, FTT cryptocurrency is at $51.64. Additionally, it has experienced a fall of 0.17% since the opening. Thus, indicating the loss of momentum near the resistance trend line. This may shortly reverse the short-term trend.
The push from the solid resistance trend line can result in the bearish reversal or even a breakdown below the support zone. Thus, resulting in a possible downfall of more than 30%. However, the trend line breakout has the potential of a strong bull run.
The RSI slope moves below the central line. The slope moves sideways after the recent fall between the 38% and 46% levels. The breakout of either can give a clear judgment of the future trend.
FTT Token crypto trades above the crucial Exponential Moving Averages, except for the 50-day EMA on the daily chart. However, the 100-day EMA provides support to the falling prices near the support zone.
The MACD and signal lines are below the zero mark on the daily chart. However, the lines may soon give a bullish crossover as the bearish histograms weaken. The crossover will generate a buy signal.
Upcoming Trend
FTX Token's technical analysis indicates that the FTT price resonates within a significant descending triangle pattern. As a result, the indicators give a slightly bullish signal. In comparison, the price action advises us to wait till the pattern breakout.
 cryptoknowmics.com