Cardano is a third-generation, decentralized proof-of-stake (PoS) blockchain platform designed to be a more efficient alternative to proof-of-work (PoW) networks. Scalability, interoperability, and sustainability on PoW networks like Ethereum are limited by the infrastructure burden of growing costs, energy use, and slow transaction times.
| Instrument | Direction | Probability (%) | Date Range |
| ADAUSD | STAY IN CASH | 45.97 | 2023-01-24, 02:00:00 – 2023-01-26, 02:00:00 |
GRW Market Analysis Software signals XRP as a buy (Source: GRWCoin)
The GRW Market Analysis Software has signaled that it may be best to not enter into a trade in ADA in the next 48 hours in the date range (2023-01-24, 02:00:00 GMT + 2 – 2023-01-26, 02:00:00 GMT + 2).
The support levels for ADA/USD identified by the GRW Market Analysis Software are $0.36796667 (first support), $0.36093333 (second support), and $0.35306667. Meanwhile, the resistance levels for ADA/USD identified by the software are $0.38286667 (first resistance), $0.39073333 (second resistance), and $0.39776667 (third resistance).
Cardano (ADA) Current Market Standing
Cardano (ADA) is ranked as the 8th biggest project in terms of market cap, according to CoinMarketCap, and experienced a 24-hour price gain of 1.33% – taking its price up to 1.33% at press time. The Ethereum-killer’s market cap currently stands at $0.3807.
ADA has seen a decrease in its total 24-hour trading volume as the figure now stands at $391,013,010 which is a 40.27% drop over the last day.
The price of Cardano is nearer to its 24-hour high of $0.3825, with its 24-hour low at $0.0.3718.
In comparison to BTC and ETH, ADA has strengthened against BTC by 0.16% and has also strengthened against ETH by 1.33%. As things stand, one ADA is worth around 0.00001658 BTC and 0.0002335 ETH.
ADA’s 24-hour gain has added to its positive week. Currently, ADA’s price is up 8.03% over the last 7 days. ADA’s price is now also up more than 54% for the current month.
Cardano (ADA) Technical Overview

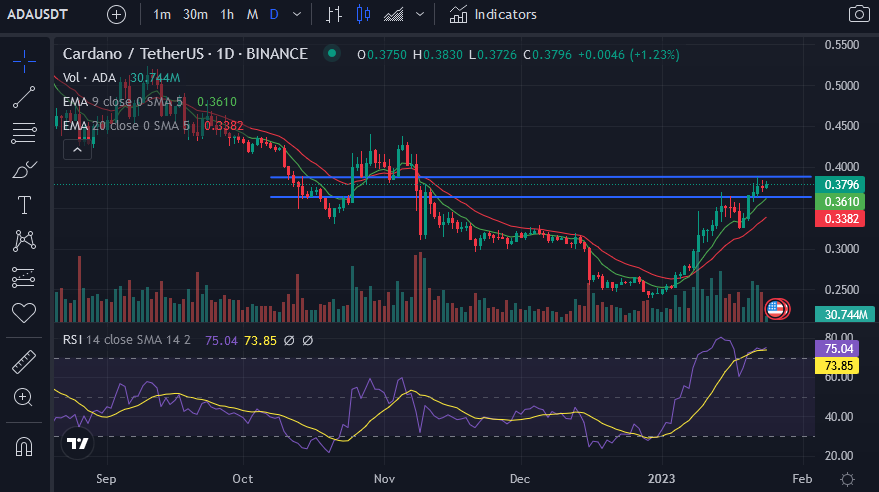
ADA’s price is currently trading within a consolidation channel between $0.3627 and $0.3879 after entering into the channel on the 21st of January, 2023.
There is a bullish flag that has been triggered for ADA on the daily timeframe with the 9-day EMA positioned above the 20-day EMA. The two EMA lines crossed on the 7th of January – signaling an upwards move that saw ADA’s price rise from a low of $0.2723 to its current level.
The daily RSI is an indicator that investors and traders should keep an eye on as the daily RSI line is looking to cross above or below the daily RSI SMA line. The daily RSI, however, is currently closer to the overbought territory at 75.04. This suggests that a downward move in ADA’s price is more likely to occur than a breakout in the next 24-48 hours.

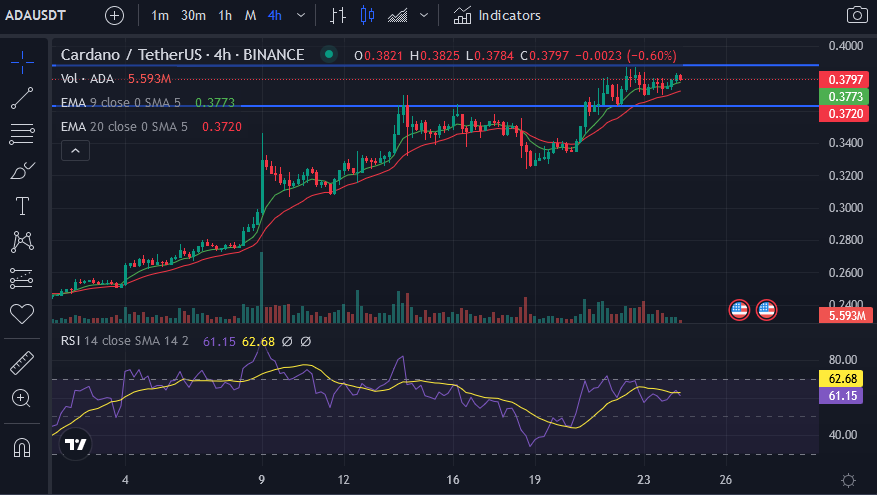
The 9 EMA line is also positioned above the 20 EMA line on ADA’s 4-hour chart. The low levels of trading volume, however, suggest that ADA’s upward move is losing momentum. As a result, ADA’s price could drop in the next 24-48 hours.
A confirmation of the bearish thesis will be when ADA’s price drops below the minor support offered by the 9 EMA line on its 4-hour chart. Thereafter, should the 20 EMA line on the 4-hour chart fail to keep ADA’s price up, then ADA’s price will drop towards the lower bound of the current consolidation channel.
Once again, investors and traders will need to keep an eye out on the 4-hour RSI indicator. Currently, the 4-hour RSI line and the 4-hour RSI SMA line are equal, with the 4-hour RSI line looking to cross above the 4-hour RSI SMA line. This will be an early indication of a mini pump in ADA’s price if it happens – invalidating the bearish thesis.
Disclaimer: The views and opinions, as well as all the information shared in this price prediction, are published in good faith. Readers must do their research and due diligence. Any action taken by the reader is strictly at their own risk. Coin Edition and its affiliates will not be held liable for any direct or indirect damage or loss.
 coinedition.com