ZIL token price is under tremendous selling pressure. The Fibonacci level of 78.60% stands strong before the bearish attack.
Zilliqa claims that it is the world's first publicly accessible blockchain to completely rely on Sharded Network. This allows it to reach high throughput, high transaction rates per second and solves the scaling issue.
Since each shard processes transactions separately, the network's capacity to process transactions per second grows as more shards are added.
Let us now look at the last few weeks of Zilliqa cryptocurrency.
Past Performance of ZIL
On 6th September, the ZIL coin price faces rejection near the $0.13 resistance level. Thus, resulting in a downfall of 40% in the past three weeks. Moreover, the downfall results in a three-black crow pattern. This could further result in the breakout of the zone near the $0.066 mark.
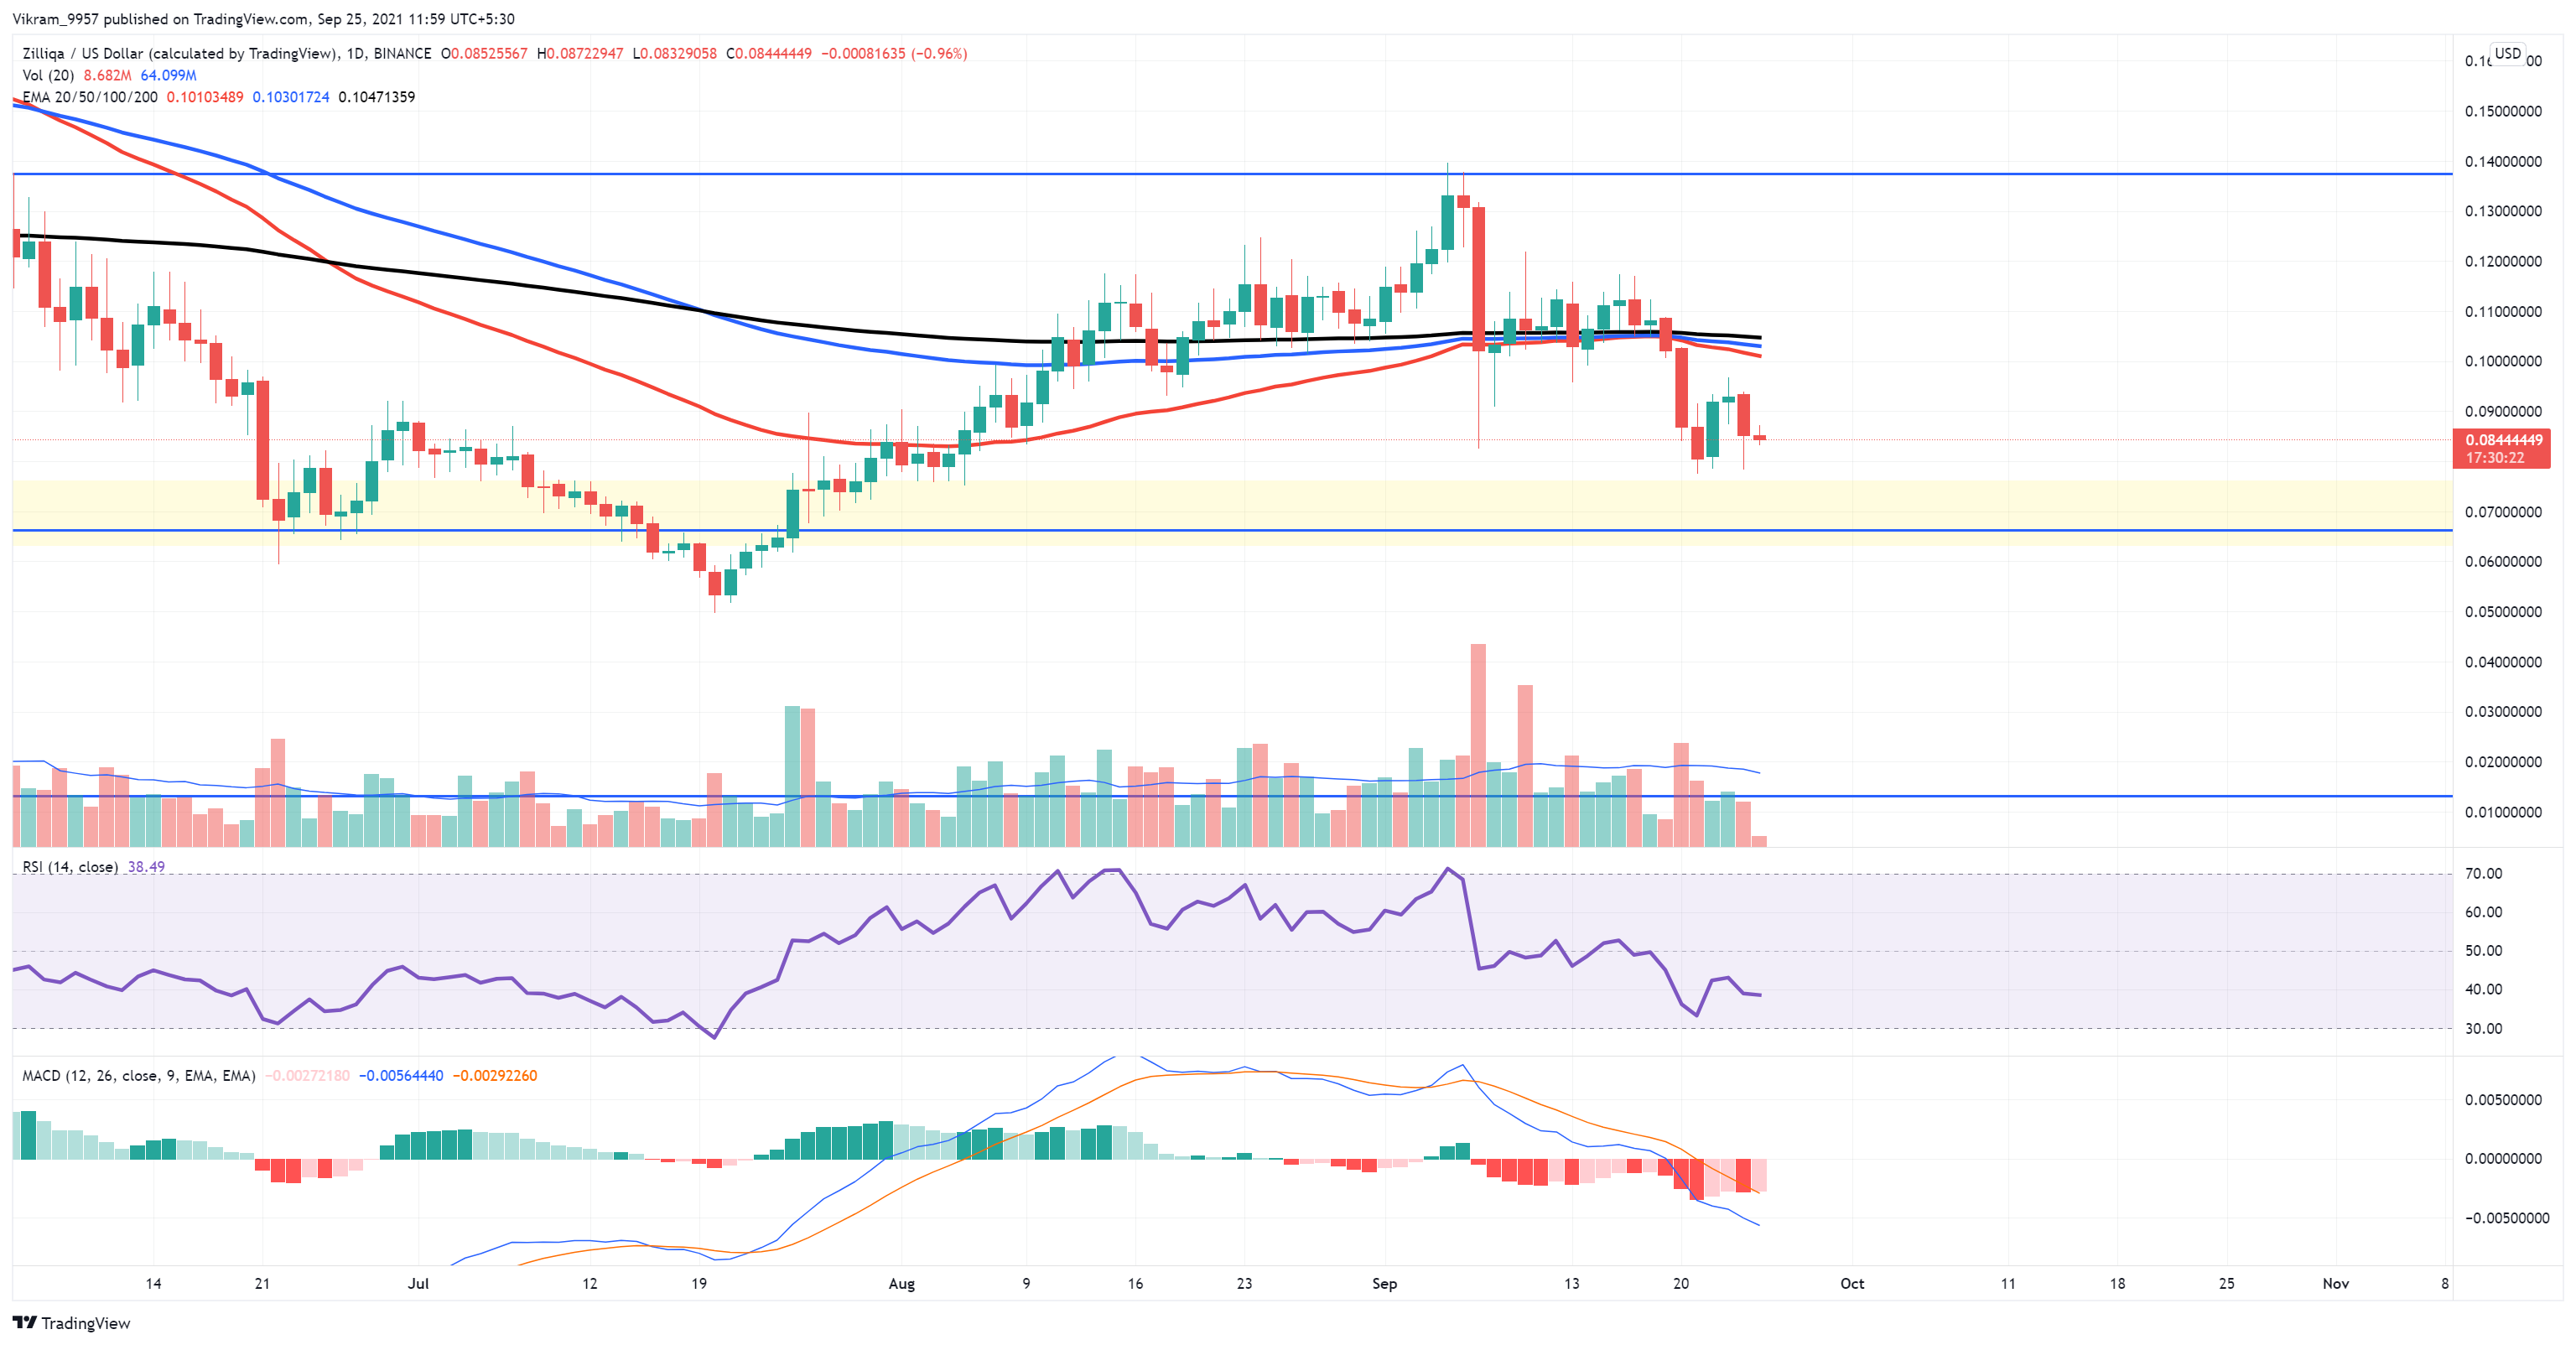
Source - Tradingview
ZIL Technical Analysis
ZIL crypto is currently at $0.08473 as of writing this article. Moreover, it has seen a fall of -6.45% within 24 hours. Thus, indicating a rise in underlying bullishness as the intraday trading volume rises by 25%.
However, the ZIL coin price may soon find demand near the $0.066 mark. It could result in a bullish reversal. Thus, investors can see this dip as a possible opportunity to buy and hold, but a bit riskier.
A breakout of the consolidation range could bring about a huge move. Safe traders should wait for the breakout of the consolidation range rather than swinging within it.
Zilliqa crypto trades below all of the critical EMAs on the daily chart. In a bearish alignment, the EMAs are also lower.
MACD and signal lines on daily charts head below the zero level in bearish alignment with decreasing intensity bearish histogram. This will result in a sell signal.
After facing rejection at the 70% overbought border, the slope of the RSI indicator tends to be lower. The slope is currently at 38%. The recent pushback in RSI is a sign of bullish pushback.
Upcoming Trend
As per the Zilliqa technical analysis, the coin is under tremendous selling pressure. And the breakout of the support zone near the 78.60% Fibonacci level seems inevitable. However, the possibility of a reversal remains uncrossed.