ENJ token price moves sideways within a range. Compressing the trend momentum, breakout of this range will bring a massive move.
Enjin is the company behind Enjin Coin, which provides an interconnected, blockchain-based gaming ecosystem. Enjin Network is Enjin's most popular offering. It allows users to create websites, clans, chat, and host virtual items stores.
Enjin lets game developers tokenize in-game items using the Ethereum Blockchain. To back digital assets, it uses the Enjin coin, a token. Items can then be sold, bought, and traded with real-world value.
Let us now look at the technical analysis of the ENJ token.
Past Performance of ENJ
ENJ coin price moves sideways under a consolidation range. The coin price fell about 40% in the past few weeks. Thus, resulting in the short-term downtrend. However, the fall approaches the $0.90 support level which can push the price higher within the range.
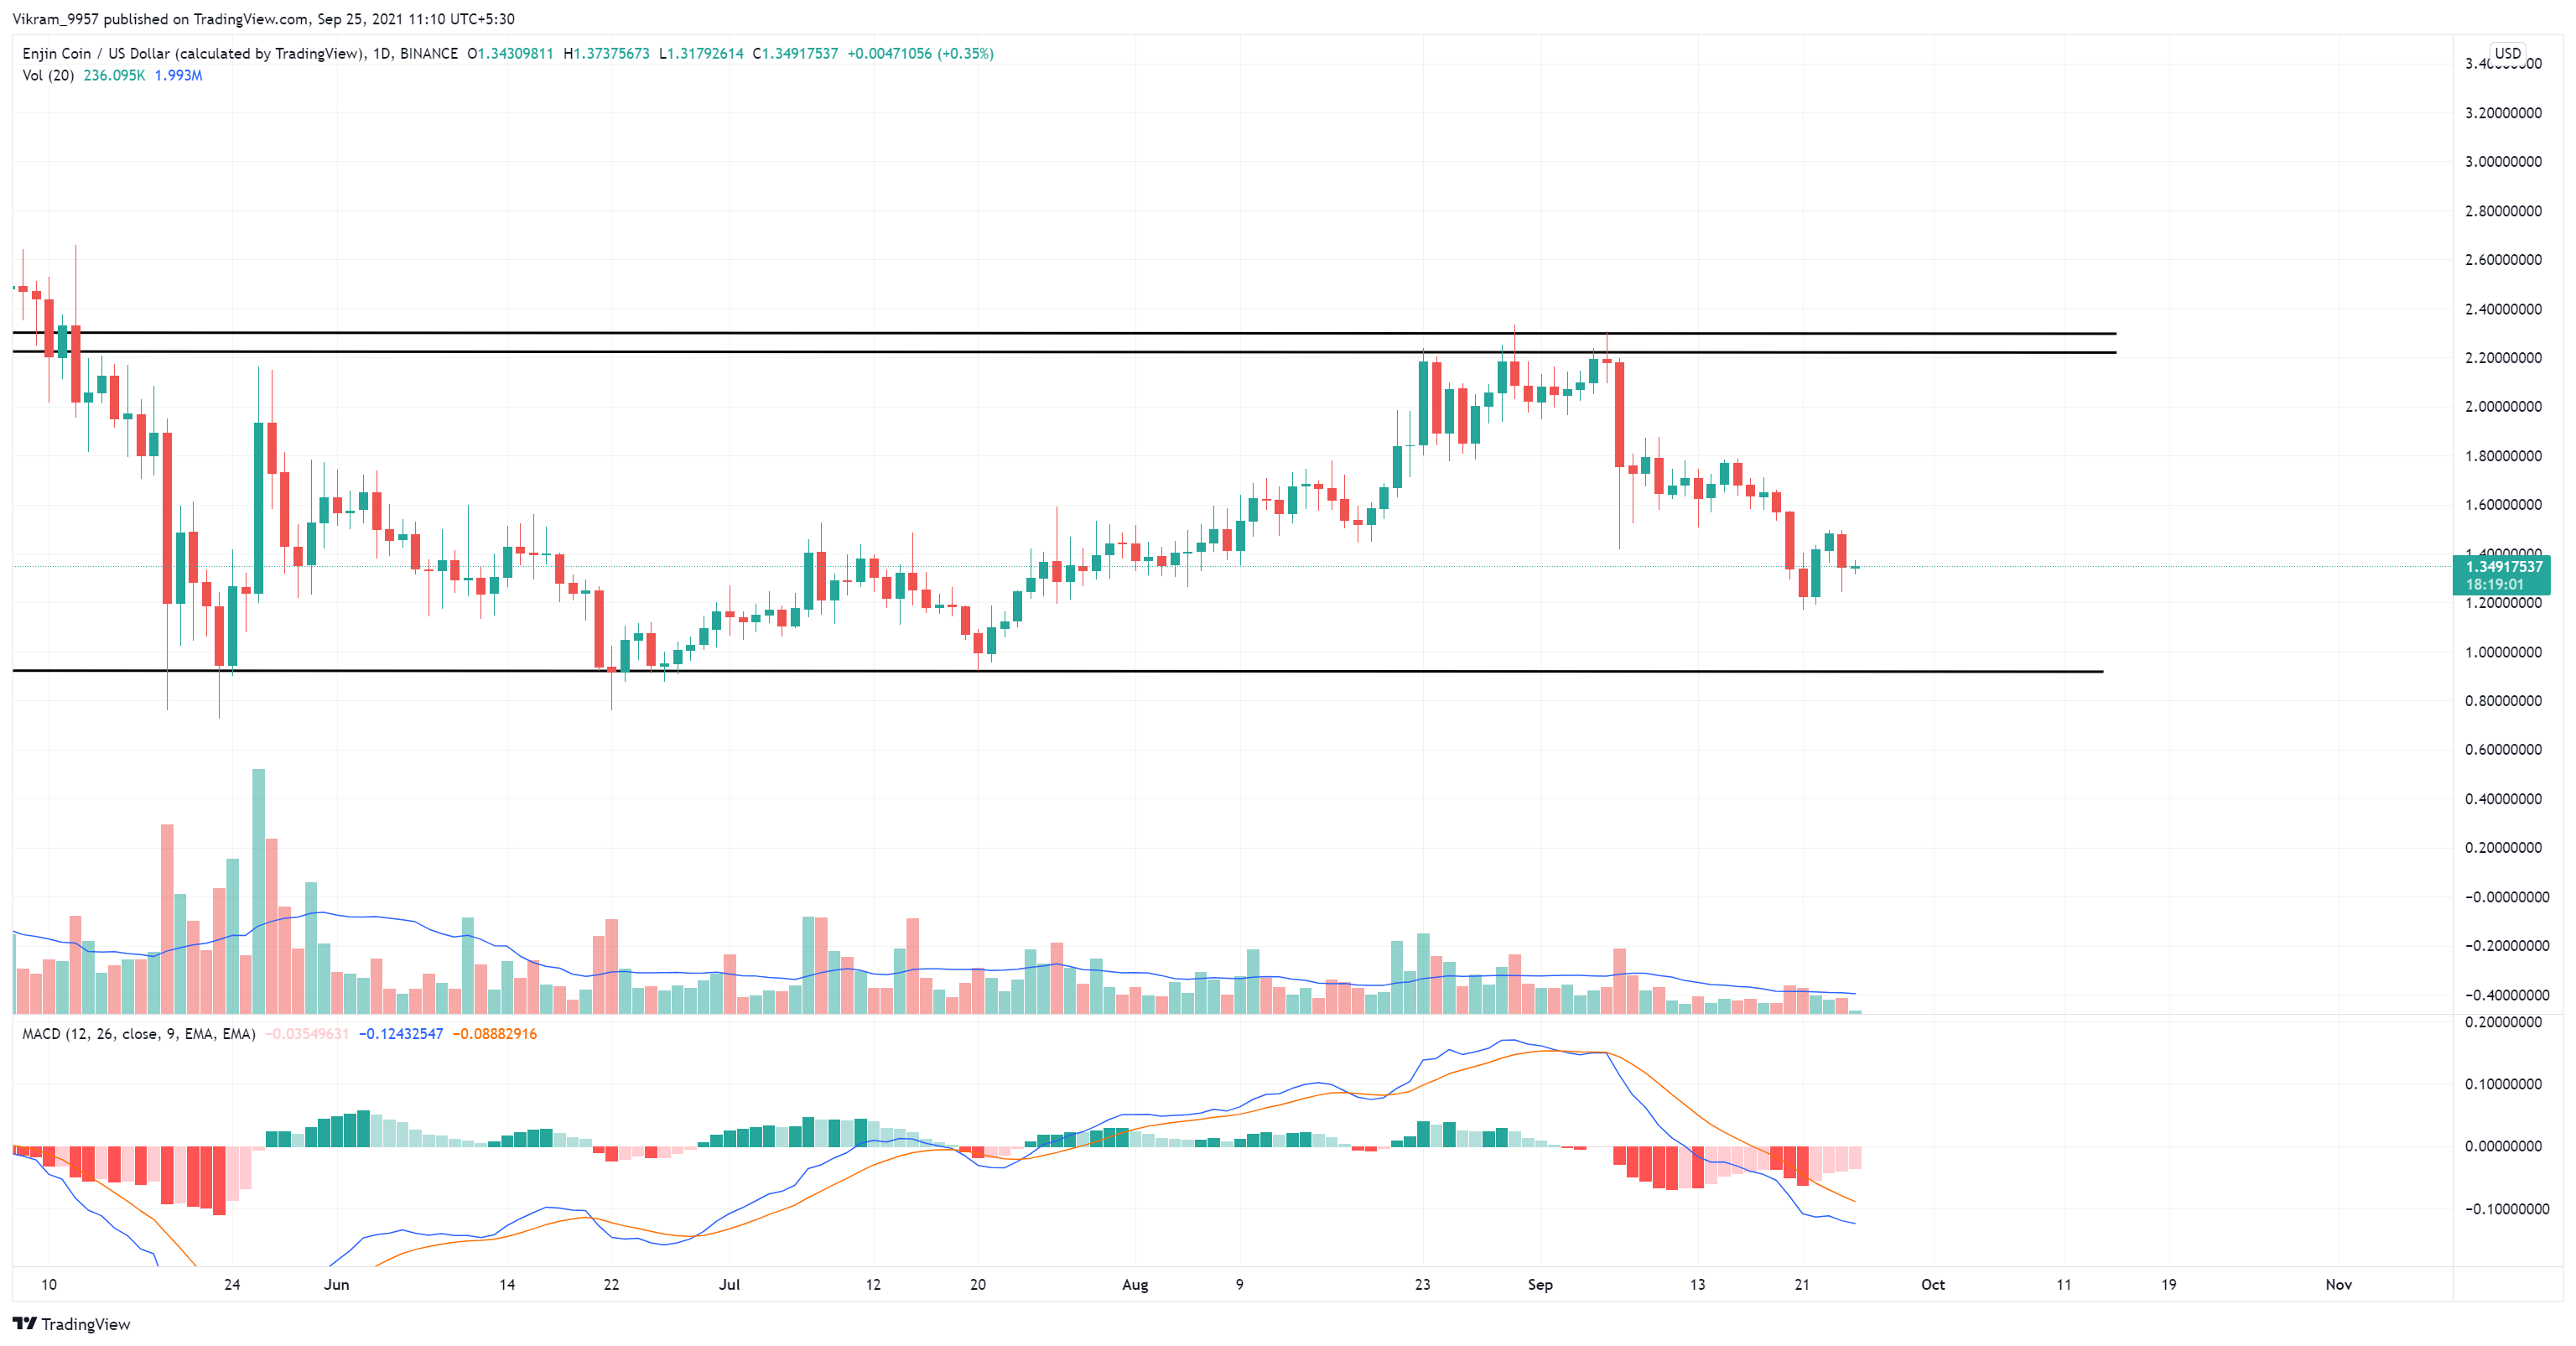
Source - Tradingview
ENJ Technical Analysis
ENJ crypto is currently at $1.34 as of writing this article. Moreover, it has seen a fall of -5.34% within the last 24 hours. Thus, indicating a rise in underlying bullishness as the intraday trading volume rises by 20%.
However, ENJ coin price may soon find demand near the $0.90 mark. It will result in the reignition of the bullish phase. Thus, investors can see this dip as an excellent opportunity to buy and hold.
The breakout of this consolidation range can bring a massive move on either. Safe traders can wait for the range breakout rather than swinging within the range.
The ENJ coin may find support at the $0.90 or $0.50 mark per the price action. And in the event of a bullish reversal, the resistance zone near $2.3 or $2.75 can push the price below.
MACD and signal lines on the daily chart head below the zero level in a bearish alignment with decreasing intensity of the bearish histogram. Thus, resulting in a sell signal.
The slope of the RSI indicator rises higher after teasing the oversold boundary. The slope rests at 34%. This recent rise indicates a pushback from the bulls, trying to overtake the trend.
Upcoming Trend
As per the Enjin technical analysis, indicators give a double-sided view. However, the price action suggests a rise near the $0.90 mark. However, we must always assume the possibility of consolidation breakout.