Monero was launched in 2014 considering privacy and security as their biggest priority. XMR allows transfer and payments quickly and inexpensively. XMR is designed to keep the identity of the sender and recipient obscure by using advanced cryptography, unlike BTC. Let us look at the technical analysis of XMR.
Past Performance of Monero
On September 18, 2021, XMR opened at $262.87. On September 24, 2021, XMR closed at $233.09. Thus, in the past week, the XMR price has decreased by approximately 11%. In the last 24 hours, XMR has traded between $224.25-$254.38.
https://www.tradingview.com/x/u2uaun3o/
XMR Technical Analysis
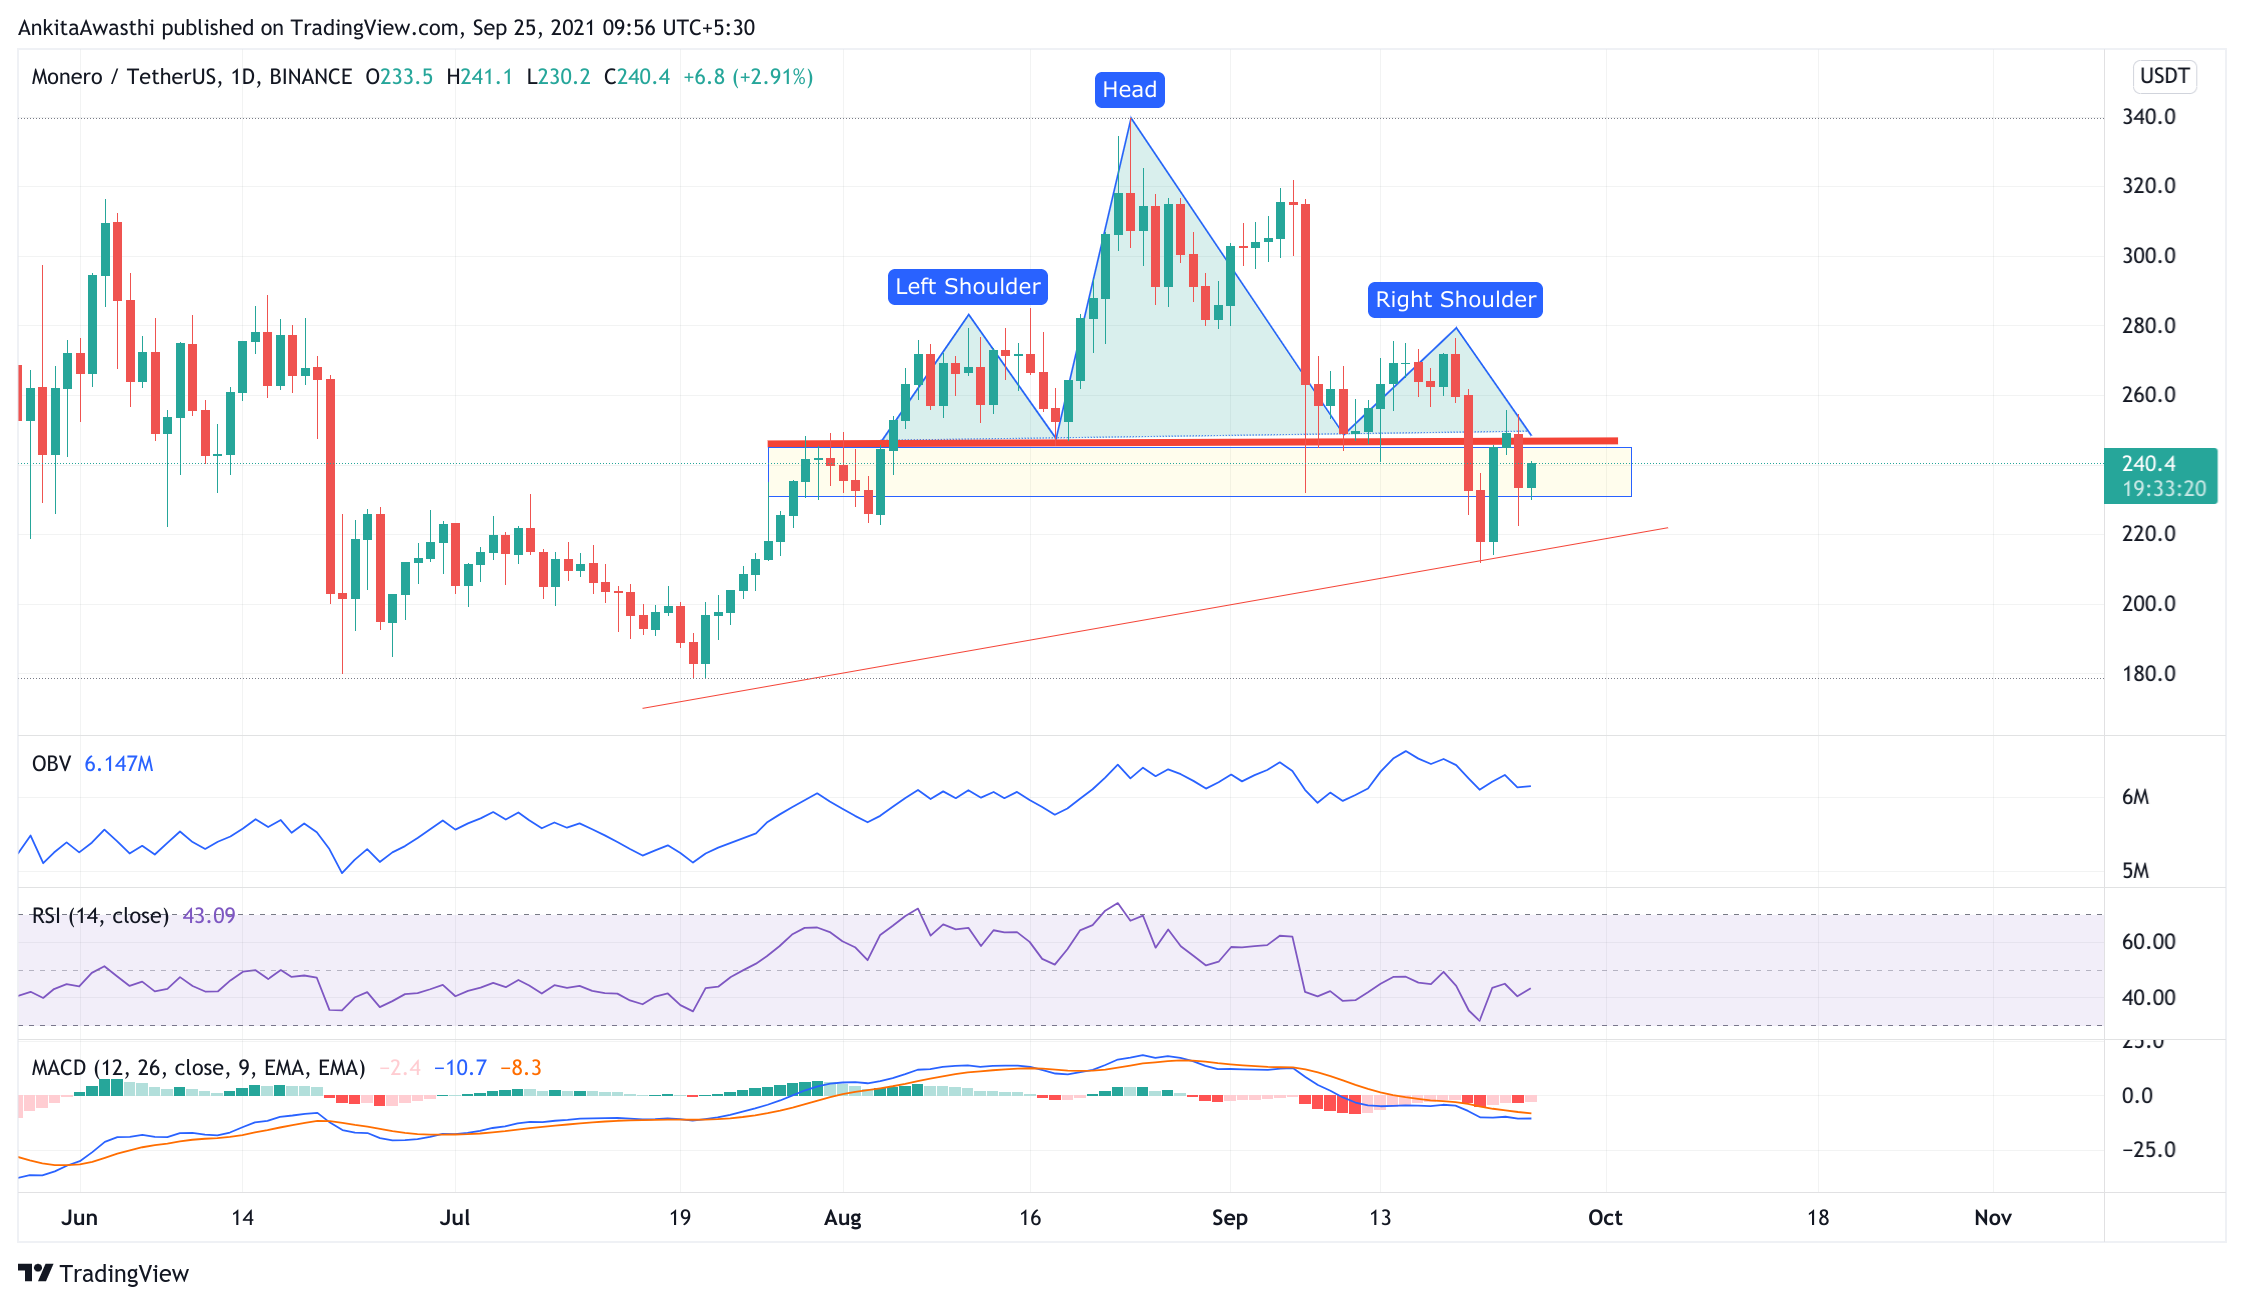
On the daily chart, we can see that the price has broken down after forming a head and shoulders pattern, which is a bearish pattern. However, the impact of breakdown was not that big. The price took support from the long-term trend line and did not change its track. The long-term momentum remains bullish.
Currently, the price is retesting the resistance line. If the price breaks out of the resistance zone, it will try to make new highs. After yesterday’s shakedown, it is difficult for the price to break out of the resistance zone for some days. Let us see what the indicators are indicating:
Currently, XMR is trading at $240.82. The price has decreased from the day’s opening price. Thus, the selling pressure seems high.
The MACD and signal lines are in the negative zone. Moreover, a bearish crossover by the MACD line over the Signal line has occurred. Thus, the overall market momentum looks bearish.
Currently, the RSI indicator is at 43%. It faced rejection at 31% and rose to this level. Thus, buying pressures are slowly mounting. We have to wait and watch if buying pressures become strong enough to bring about a bearish trend reversal.
The OBV indicator is currently in a downward trend. High selling activity will exert downward pressure on the XMR price.
In short, when we look at all three oscillators, we can say that the price may continue to rise. However, we cannot rule out the possibility of a trend reversal. We have to wait and watch to see if an intermittent price rise is a corrective action or the beginning of a positive trend.
Day-Ahead and Tomorrow
Currently, the price is below the Fibonacci pivot point of $246.84. If the bears remain strong till day end, then the price is likely to fall below the first, and second support levels of $223.09, and $213.01, respectively.
The price has tested and fallen below the 61.2% FIB retracement level of $245. The price is currently forming a narrow range, a breakdown and breakout from this level will highlight further levels.