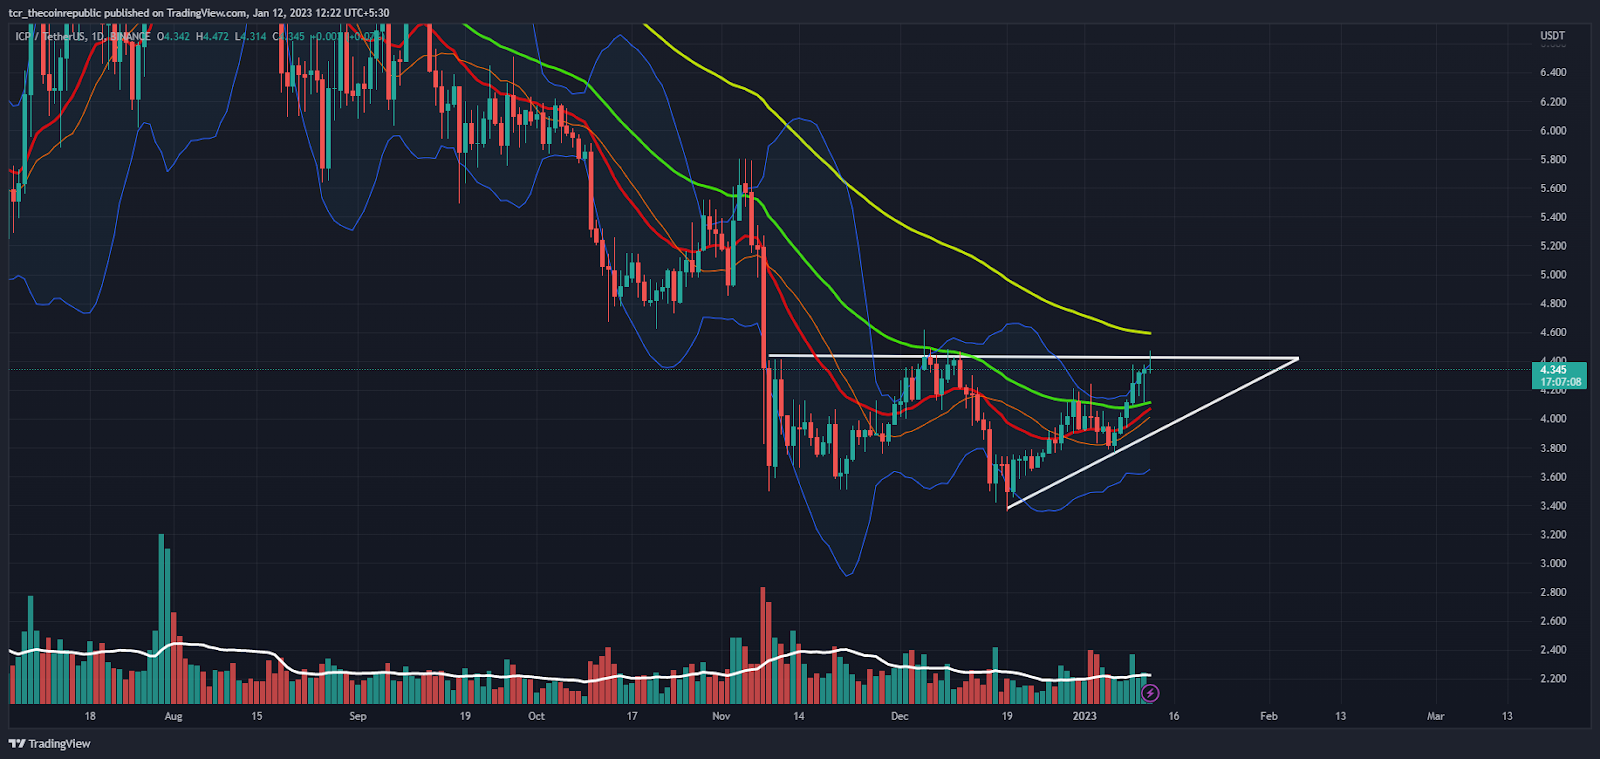
ICP price in the last session noticed follow-up buying with long wick formation. Bulls are taking support at 50 days EMA. This activity makes the bears tense, and buyers are gradually creating longs. The chart formation constructs an ideal setup where a swing over the hurdle of $4.50 can be seen.
Internet Computer token price in the recent sessions stayed in the narrow range and formed an ascending triangle pattern. However, the price is now transiting the upper Bollinger band, but a strong resistance was there. Though, with lower volumes, bulls lack the momentum to escape the range.
Daily Chart Shows Price Accumulation

Source: TradingView
On the daily chart, Internet Computer token attempts to smash the neckline of the ascending triangle pattern, which was positioned at $4.40. Moreover, the buyers energetically make long positions where bears also hold their grip.
ICP price is now trading at $4.32 with an intraday gain of 1%. Moreover the pair of ICP/ BTC is at 0.0002388 satoshis. From the last 3 trading sessions, ICP jumps nearly 10% showing bullish cues.

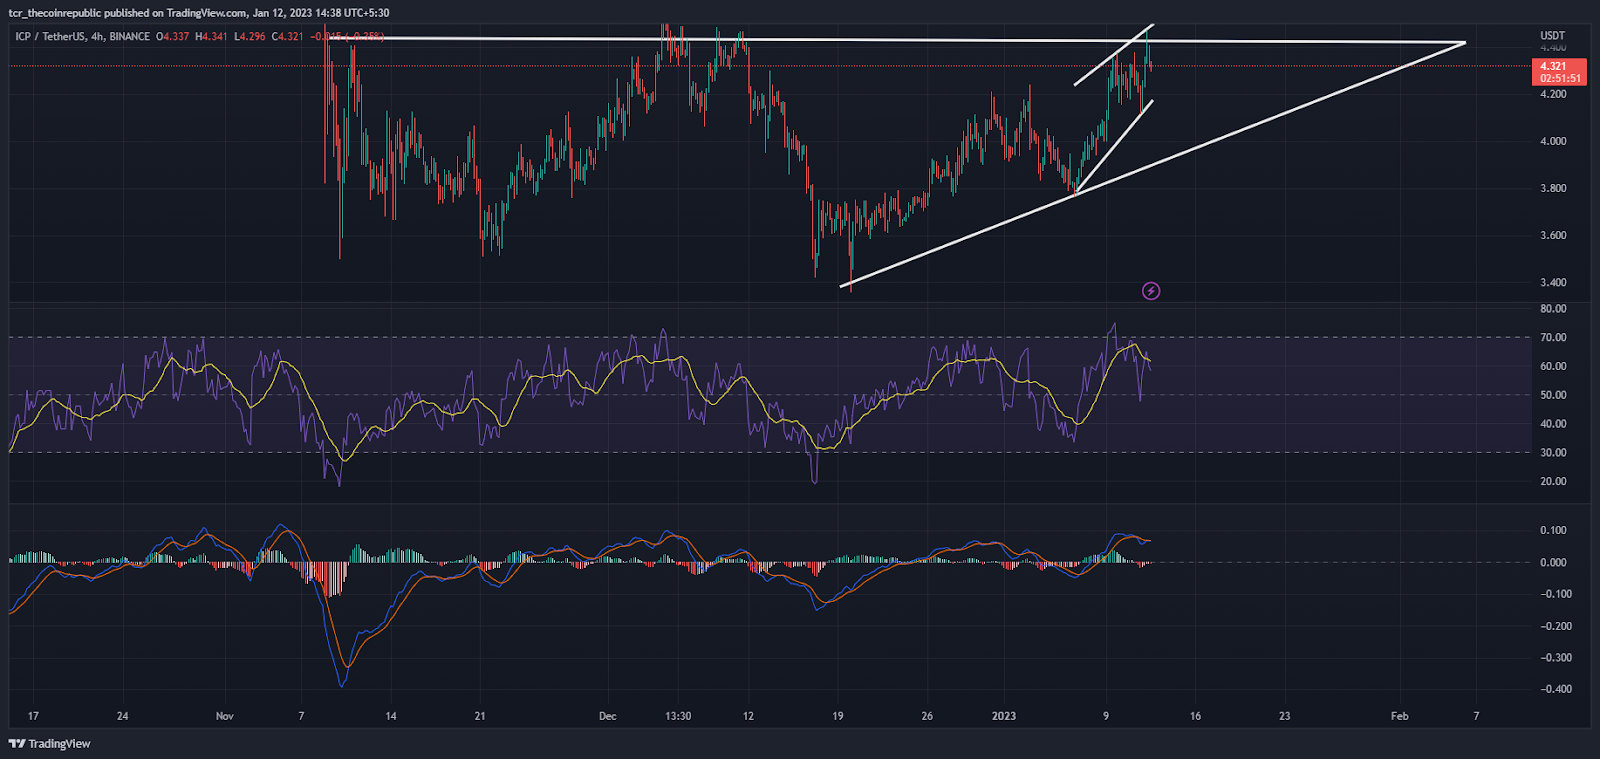
On the 4 hours chart, ICP sets a positive outlook and is near its resistance mark. Despite that, the delivery volumes were not much in the rage of bulls that could not scratch the breakout range.
The price sustains above 20, 50 days EMA and looks to test 100 days EMA in the upcoming sessions. Moreover, the price trades at the top of the upper Bollinger band and more upsides are yet to happen.
RSI: The RSI curve is at 57, forming a positive outlook for buying. However, it is now favourable for new investors and holders to enter. In the earlier sessions, the curve returns from the overbought range to the neutral zone and, again, pullbacks, so the risk-reward ratio is favourable for investors.
MACD: The MACD curve coincides and is looking to note a crossover in the near sessions. Moreover, a fake crossover was seen in the previous session, which did not endure.
Conclusion
Internet Computer price is now at a prominent stage to showcase a new swing in upcoming sessions. However, it tries to break the upper range in the previous sessions but is not sustained. More bullishness may be noticed if the bulls cross the neckline of $4.50 and sustain over there.
Technical levels
Resistance levels: $4.50 and $5.20
Support Levels: $3.70 and $3.30
Disclaimer
The views and opinions stated by the author, or any people named in this article, are for informational purposes only, and they do not establish financial, investment, or other advice. Investing in or trading crypto assets comes with a risk of financial loss.
 thecoinrepublic.com