The XRP price has increased considerably since saving a breakdown on Jan. 2. A daily close above $0.384 could further accelerate the rate of increase.
More than two years after the snapshot was taken, XRP holders finally received the Flare (FLR) airdrop on Jan. 9. 15% of the tokens were distributed on this date, while the other 85% will be distributed in monthly increments over the next 36 months.
The XRP price has reacted positively to the event and is mired in an upward movement that accelerated on Jan. 11. However, it is worth mentioning that the ongoing Ripple vs SEC case will likely not be resolved until Q2 2023. Whether the resolution is positive or negative could have a tremendous impact on the price.
XRP Price Spared Breakdown
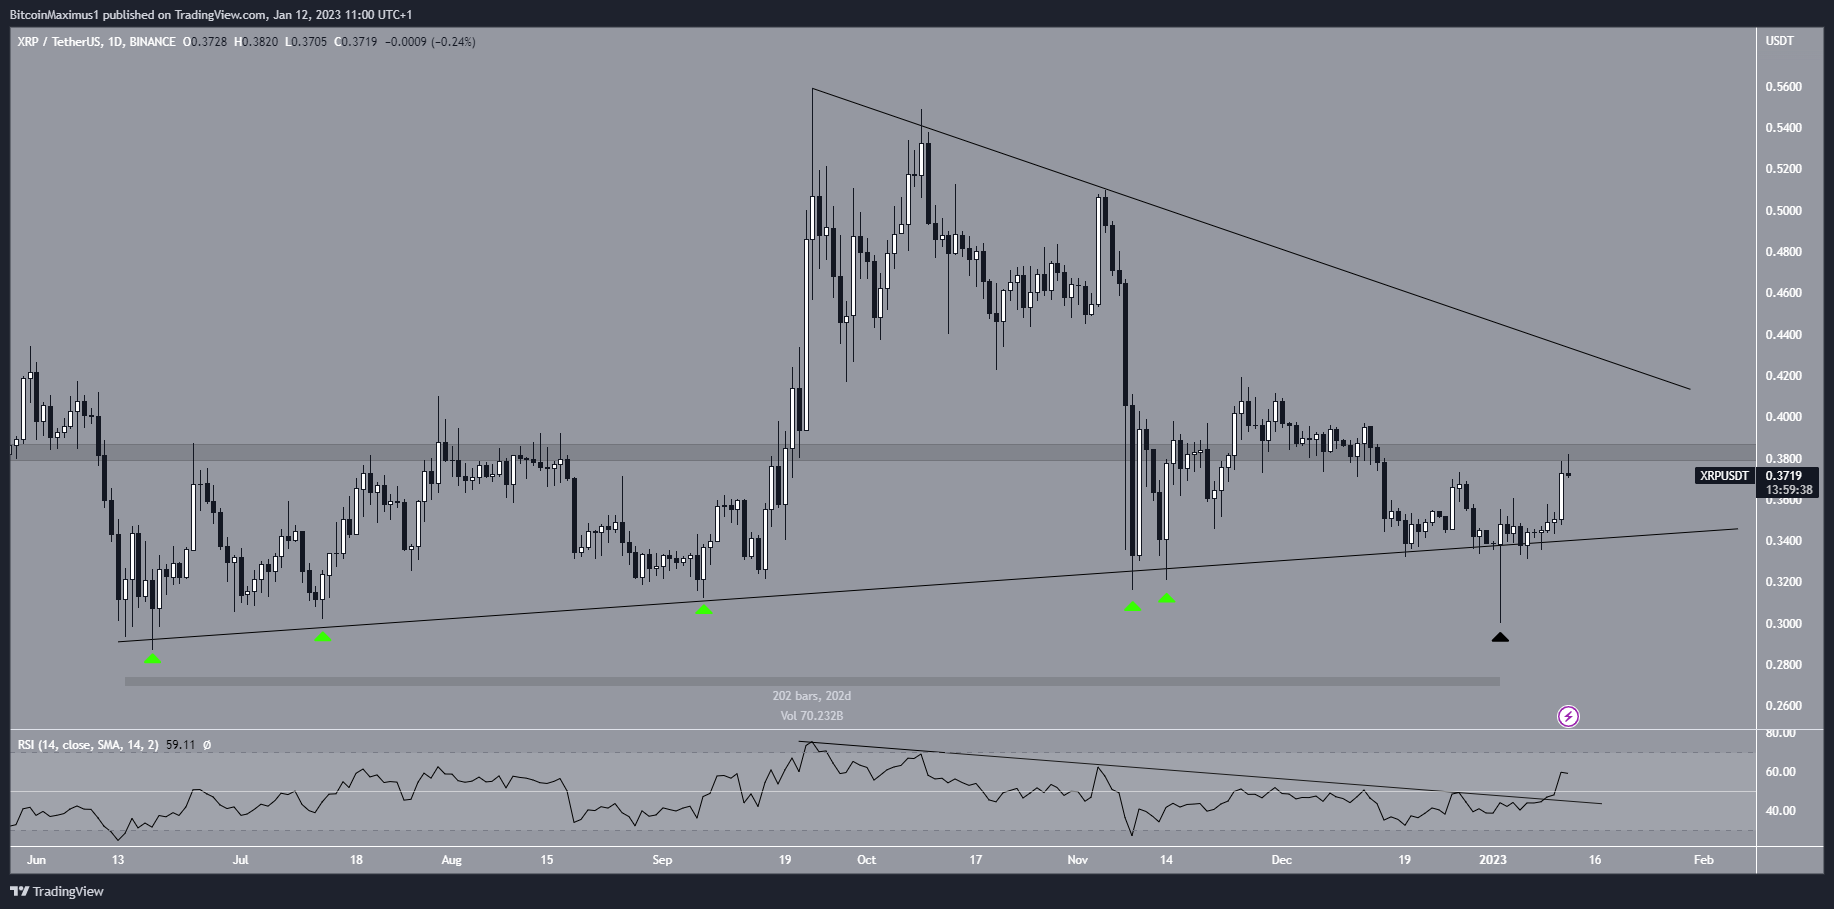
The XRP price has increased alongside an ascending support line since reaching a minimum price of $0.287 on June 14. Until now, the price bounced at the line five times (green icons). On Jan. 2, it seemed like the Ripple price finally broke down from the support line, which had been in place for 202 days.
However, it created a long lower wick and a bullish hammer candlestick on the same day (black icon). This saved the breakdown and catalyzed the current upward movement, which has accelerated over the past 24 hours. The XRP price today is just below the $0.384 resistance area.
The ongoing increase also caused the RSI to break out from a descending resistance line (black) and move above 50. Both of these are considered signs of bullish trends. If the upward movement continues, the next resistance area would be at $0.384.
If the XRP price successfully moves above it, the next resistance would be at $0.410. On the other hand, a rejection would take it back to the ascending support line at $0.350.

XRP/BTC Struggles to Maintain Upward Movement
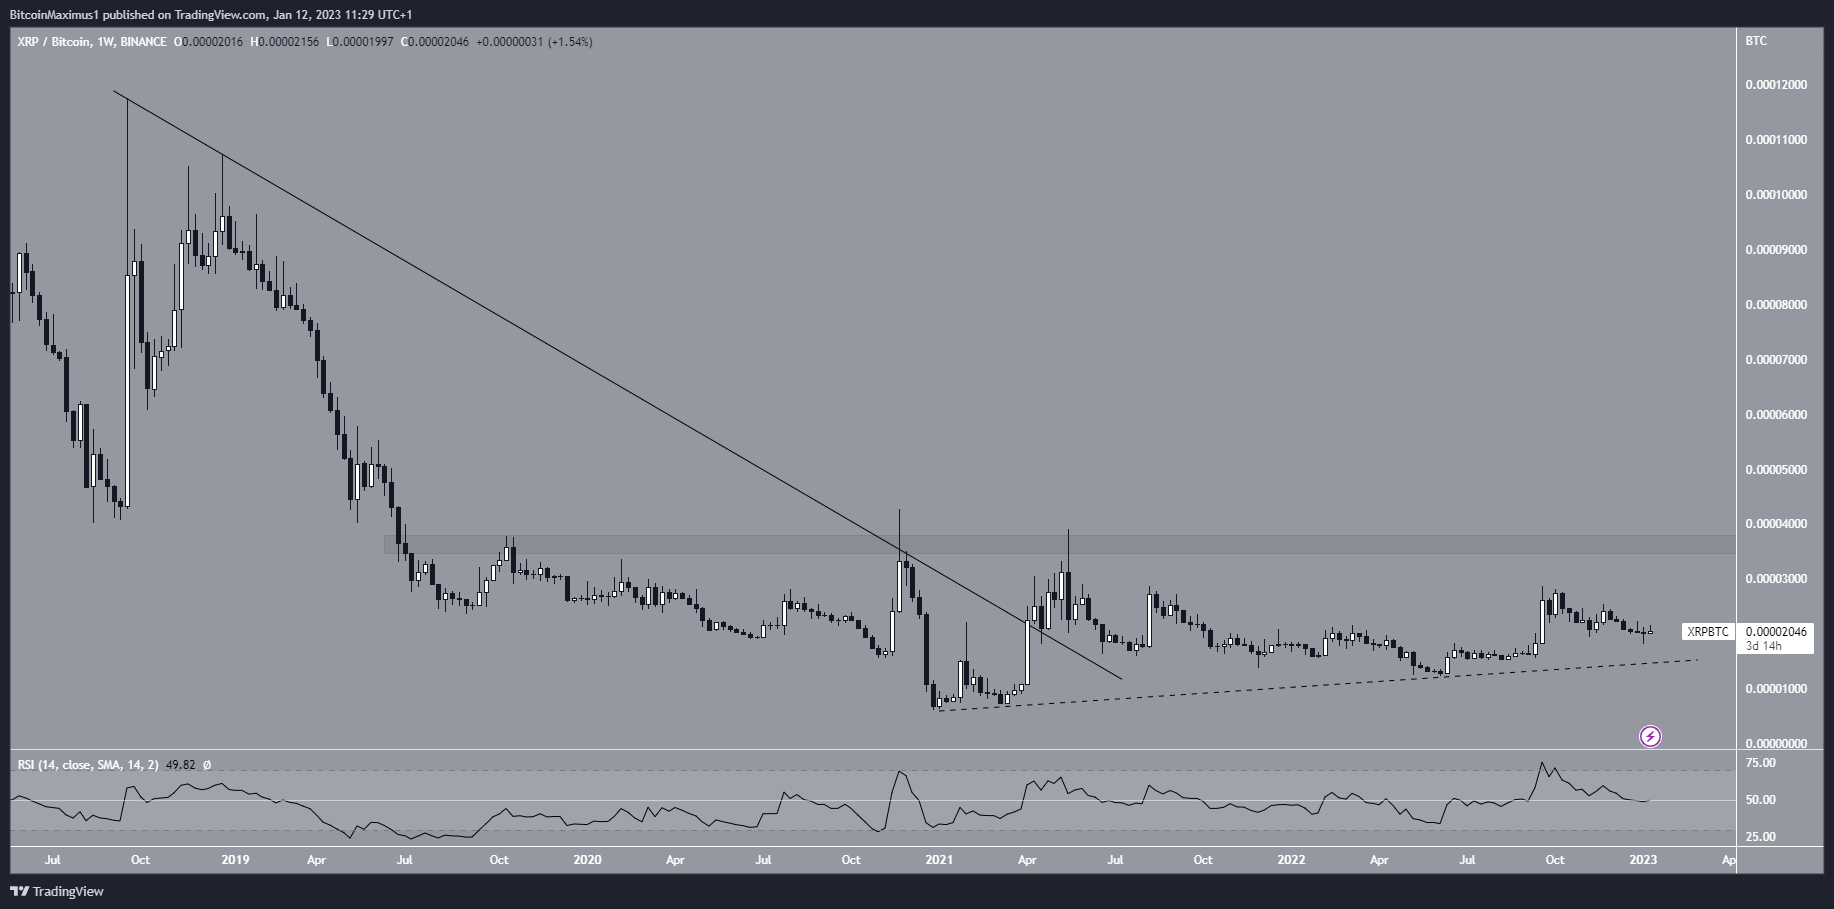
The XRP/BTC pair broke out from a descending resistance line in April 2021. Despite the breakout, it failed to sustain the upward movement and did not reclaim the 3,650 Satoshi resistance area. Doing so is required for the trend to be bullish.
However, the digital asset is still trading above an ascending support line (dashed).
The weekly RSI is at 50, a sign of a neutral trend. As a result, the direction of the future movement for XRP/BTC is unclear. Whether it breaks out above 3650 Satoshis or breaks down below the ascending support line will likely determine the trend’s direction.

To conclude, the price action for XRP/USDT looks more bullish than that of XRP/BTC. Breaking out from the symmetrical triangle would indicate that the trend for the former is bullish while reclaiming the 3,650 Satoshi area would do the same for the latter.
 beincrypto.com
