Ravencoin is a fork from the Bitcoin code and features four key changes. It has a modified issuance schedule with a block reward of 5,000 RVN, block time decreased to one minute, and coin supply capped at 21 billion (a thousand times more than BTC). A mining algorithm, KAWPOW (previously X16RV2 and X16RV2), to reduce centralization in mining due to ASIC hardware.
Ravencoin is a blockchain-based platform that aims to solve the problem of asset transfer and trading. In the past, an asset created on the Bitcoin blockchain could have been accidentally destroyed by someone trading the coins it was created with.
Past Performance of RVN
RVN coin price is facing rejection from a crucial resistance level of $0.15 mark after rising more than 150% in a bullish rally.
Last week, the token price fell 21%, making a long-tailed candlestick representing a lower price rejection.
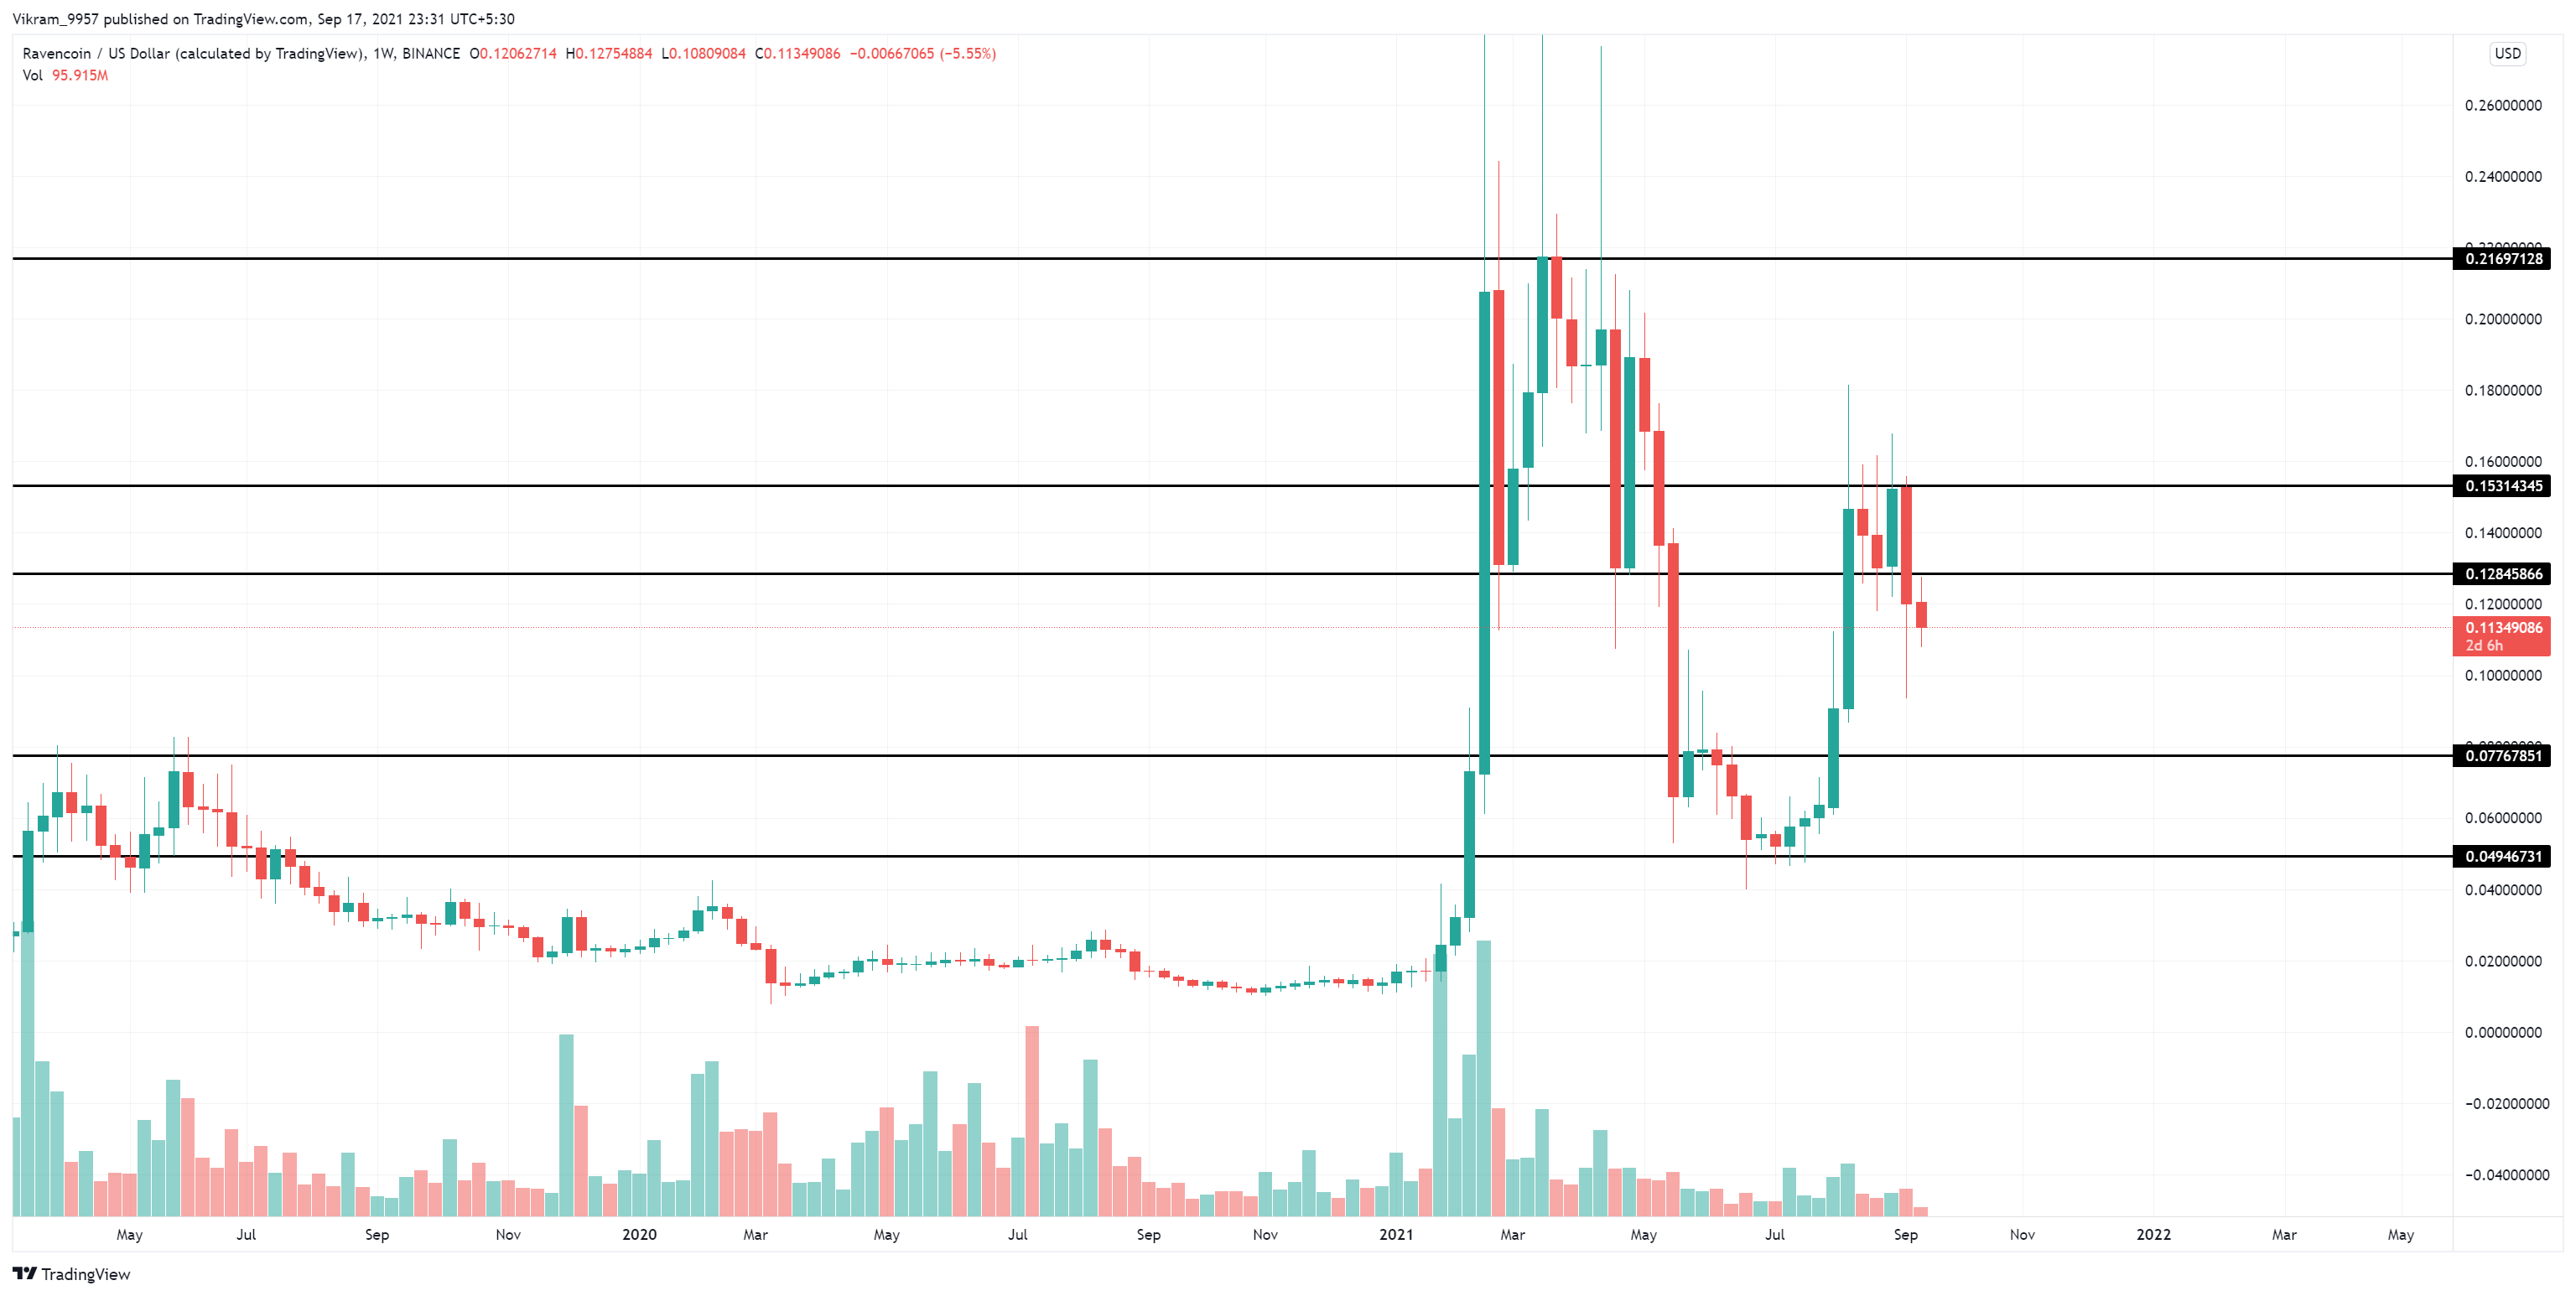
Source - Tradingview
RVN Technical Analysis
At the time of writing, the RVN coin price is trading at $0.11 with a rise of 1.84% in the past 24 hours. Ravencoin's price action projects consolidation near the neckline of a previously formed double top pattern.
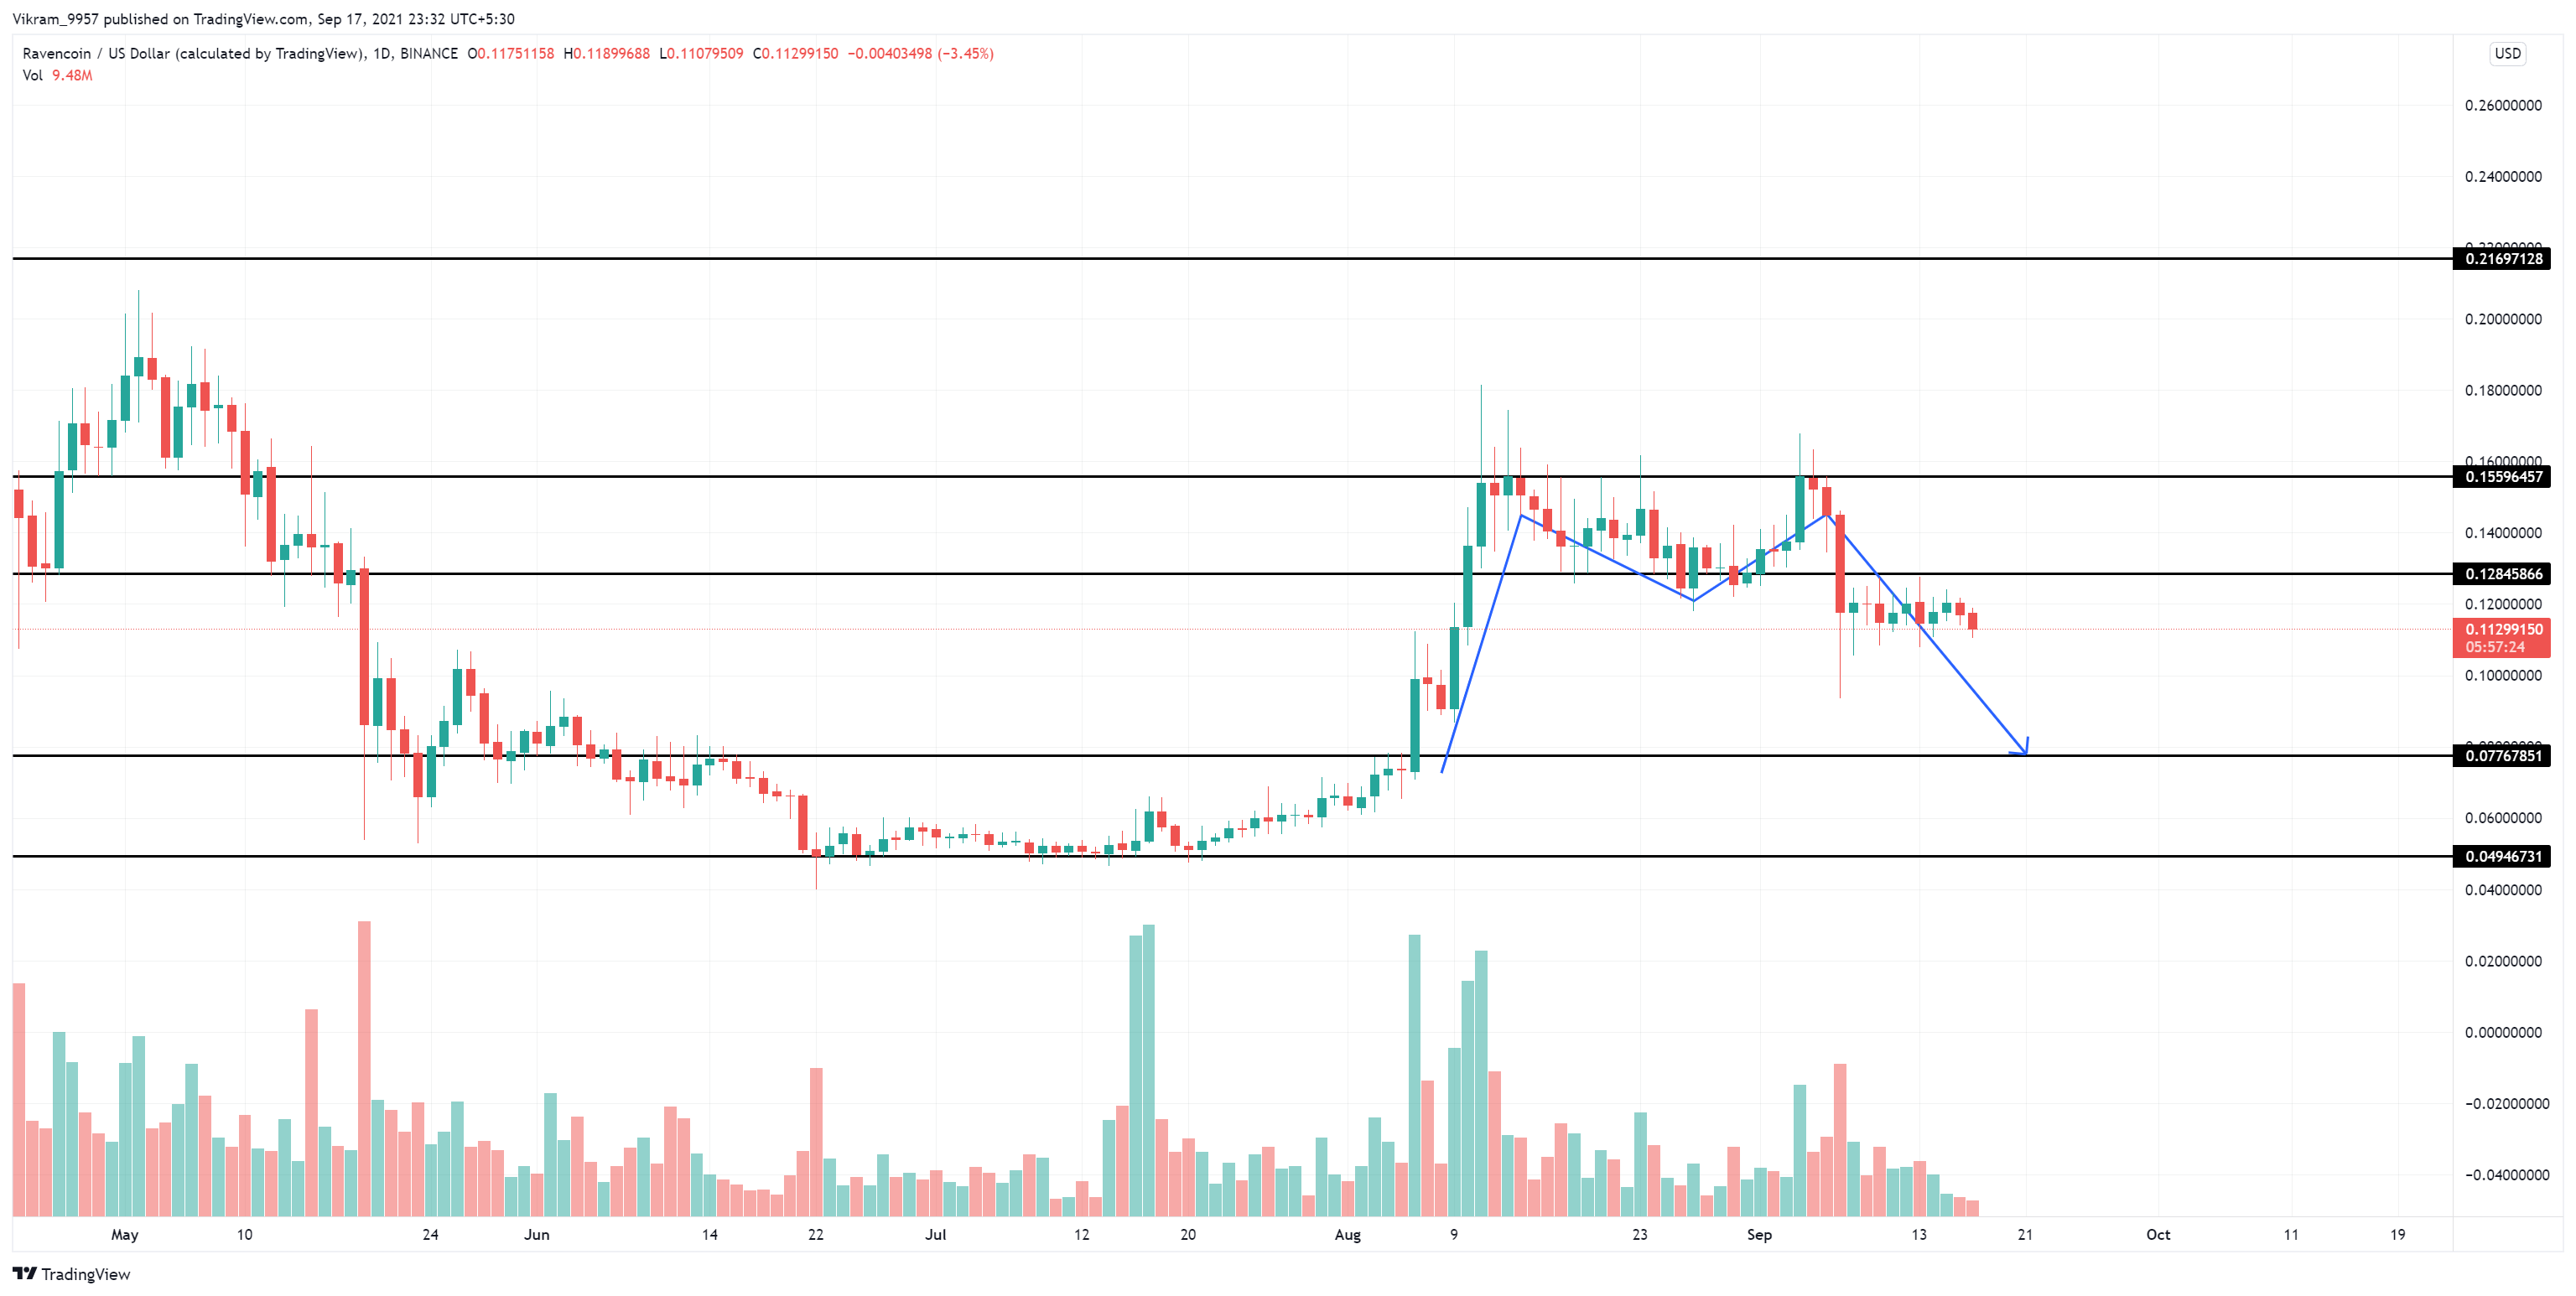
Source - Tradingview
RVN coin's consolidation phase projects the possibility of a bearish breakout due to the double top pattern. A fallout of this range might cause of price movement of 15%-30%.
As per Ravencoin's price action, the coin may find resistance near $0.13 or $0.19
And the support levels are at $0.010 and $0.0075
The exponential moving averages of 50 and 100-days EMA provide a range for the token price. Meanwhile, the 200-days moves below all the EMA. Furthermore, the 200-days slope is lower, which may soon give a bearish crossover.
Currently, the RSI indicator is moving within the center of neutral territory. However, the slope of RSI is falling despite the price jump during the double top formation. Thus, a bearish divergence has arisen, which may shortly give a result in a bearish breakout.
Day-Ahead and Tomorrow
As per the Ravencoin technical analysis, the cryptocurrency consolidates after forming a double top price pattern. This accumulation phase may briefly give a bearish breakout indicated by the RSI indicator. Nonetheless, the strong support levels like the 200-days EMA and the horizontal level at $0.010 might reverse the trend.