DCR prevents blockchain technology and prevents monopoly in the decentralized structure. Decred Protocol makes sure that DCR token holders have equal voting rights and have the same decision-making power. Let us look at the technical analysis of DCR.
Past Performance
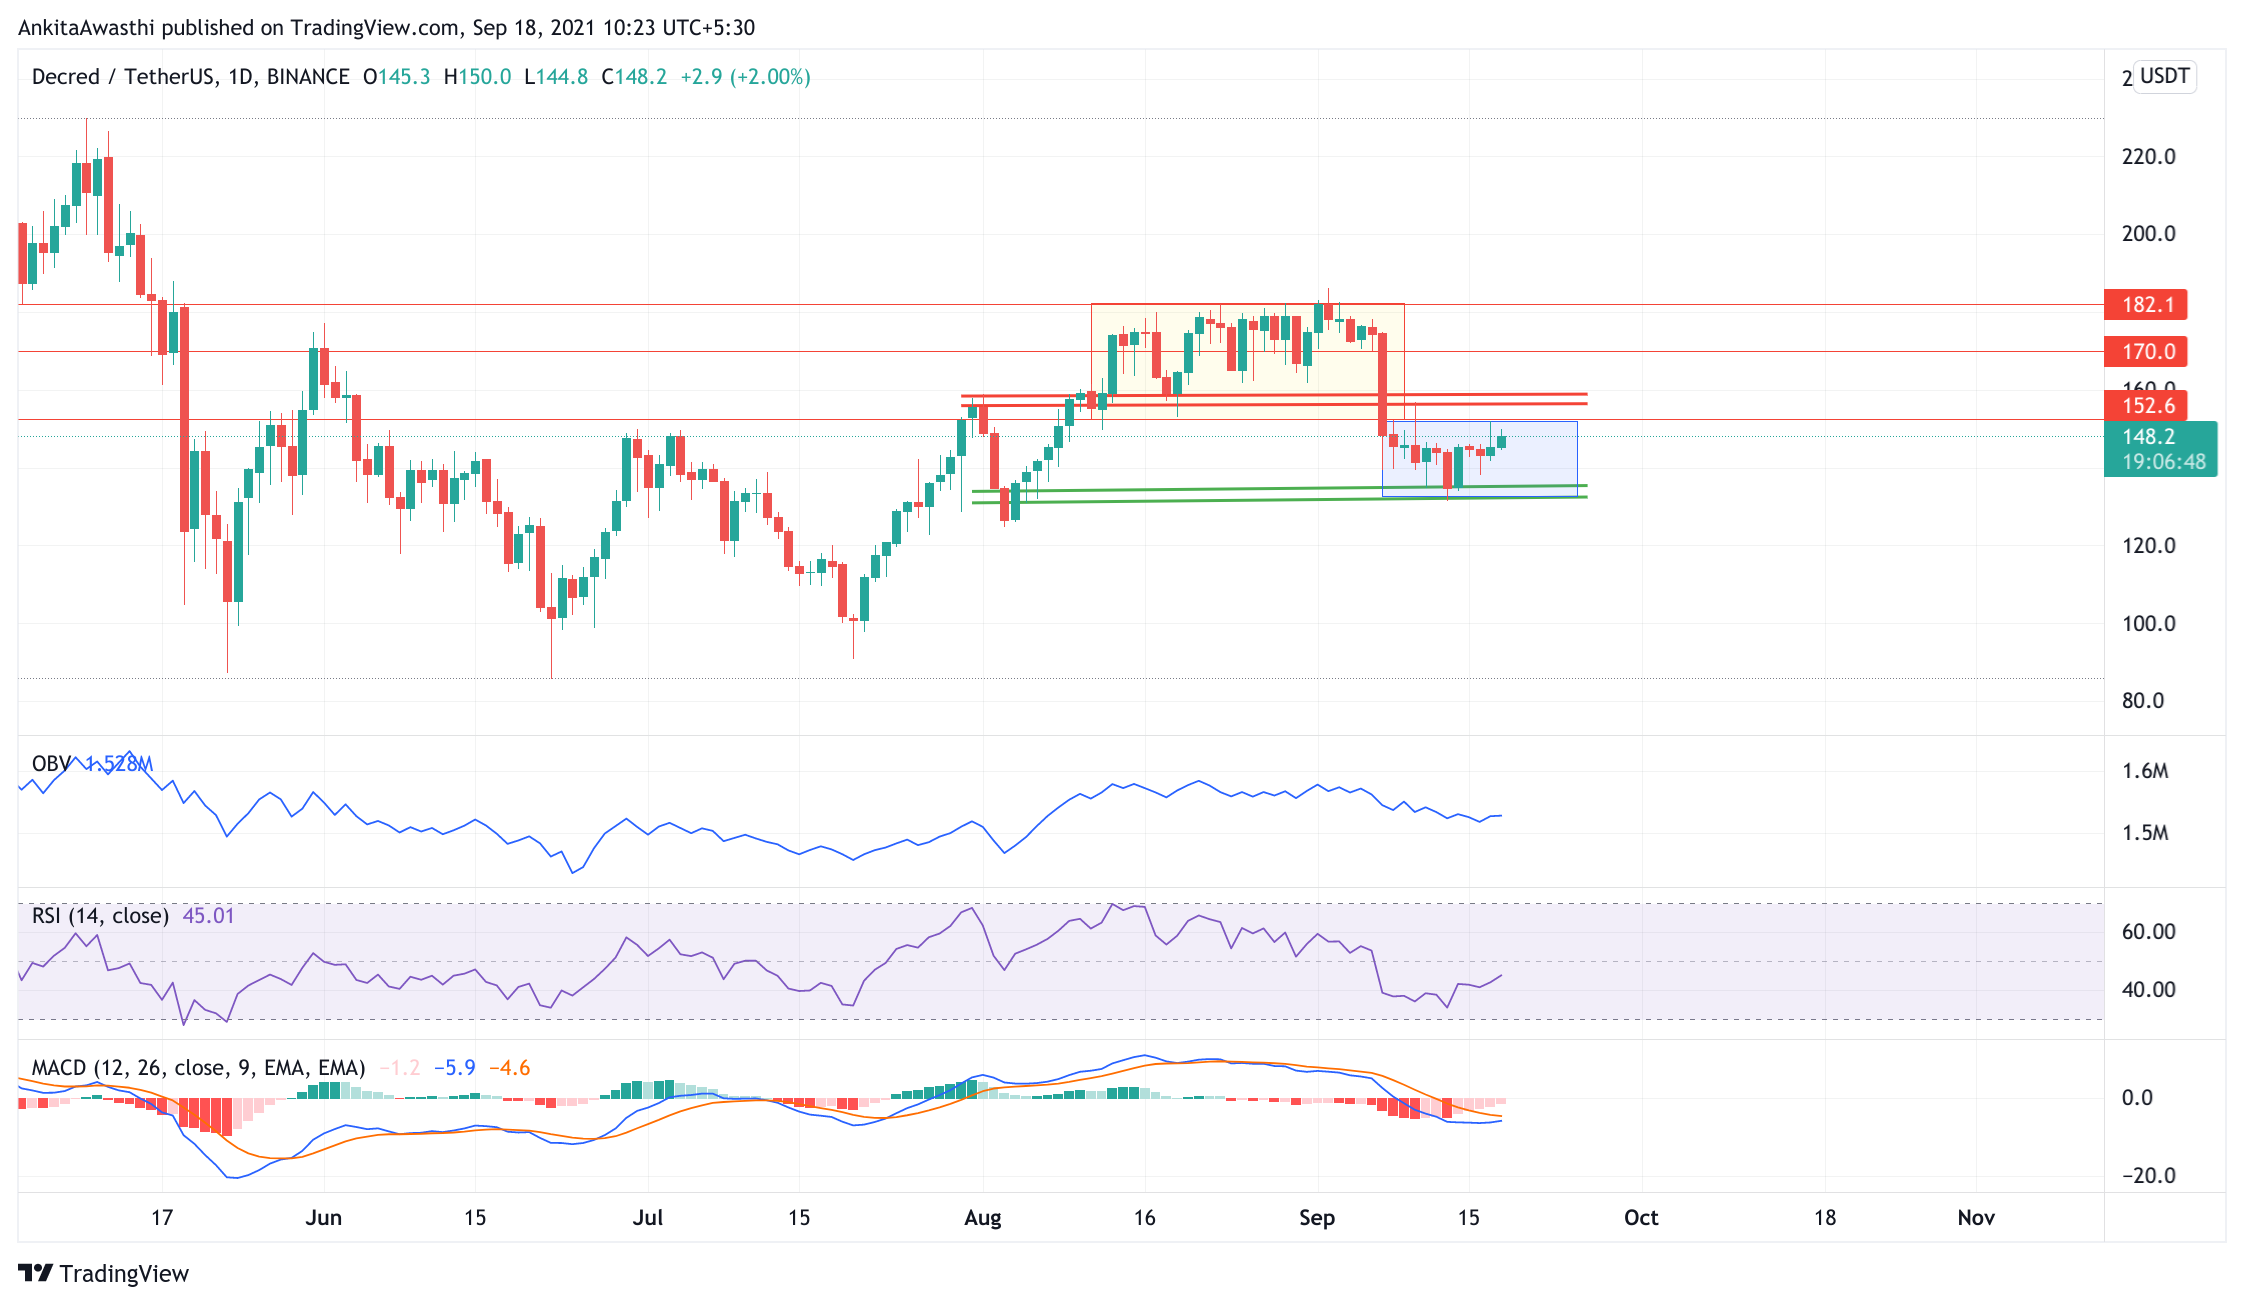
On September 11, 2021, DCR opened at $141.51. On September 17, 2021, DCR closed at $145.33. Thus, in the past week, the price has increased by approximately 2.1%. In the last 24 hours, the price has traded between $144.49-$151.41.
https://www.tradingview.com/x/ytZfdrBQ/
DCR Technical Analysis
The price broke down from its rectangular range on 7th September, when DCR declined by approximately 14%. Since then, the price took support from the $132 level and bounced back up. It is forming a rectangular range and is currently trading in that range. To predict the future trend, it will have to give a breakout on either side of the range. A breakdown will confirm the bearish trend, whereas, a breakout on the upside will unleash new highs and confirm the bullish trend for DCR.
Currently, DCR is trading at $148.84. The price is approximately a percent up from the day’s opening price. Thus, it seems like bulls have taken control of the market. However, the $132 level has acted as strong support since the 7th September crypto correction. Any breakdown from this level will confirm the bear trend.
On the daily chart, the MACD and signal lines could not cross the zero range. Now, with a bullish crossover by the Signal line over the MACD line, we can expect it to crossover the zero range. Thus, the overall market momentum looks bullish. Hence, the price may rise further for the rest of the day.
Currently, the RSI indicator is at 42%. It faced rejection at 35.84% and has risen straight to this level. Thus, it indicates that the selling pressure is high in the market. Moreover, the RSI is forming a bullish divergence.
Day-Ahead and Tomorrow
The DCR is trading below the second Fibonacci pivot point of $152.58. If the bears take control for the rest of the day, then the price is likely to fall below the first, second, and third support levels of $148, $142.66, and $137.86, respectively.
However, if the buyers remain strong for the rest of the day, then the first resistance level DCR has to break is $152.30. Once this pivot level is broken, the price will highlight the next FIB resistance level of $163.85. Traders can take a short position accordingly.